Comparative Study
. 2008 Oct 3;322(5898):104-10.
doi: 10.1126/science.1158684. Epub 2008 Aug 21.

High-quality binary protein interaction map of the yeast interactome network

Affiliations
Comparative Study

High-quality binary protein interaction map of the yeast interactome network

Haiyuan Yu et al. Science. .

Abstract

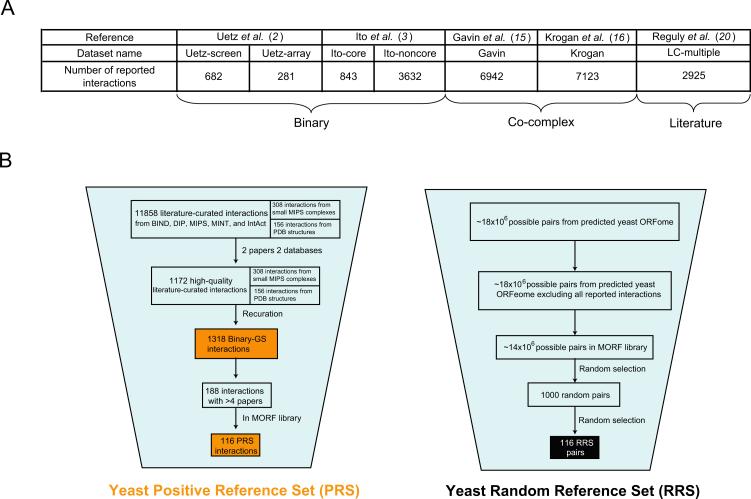
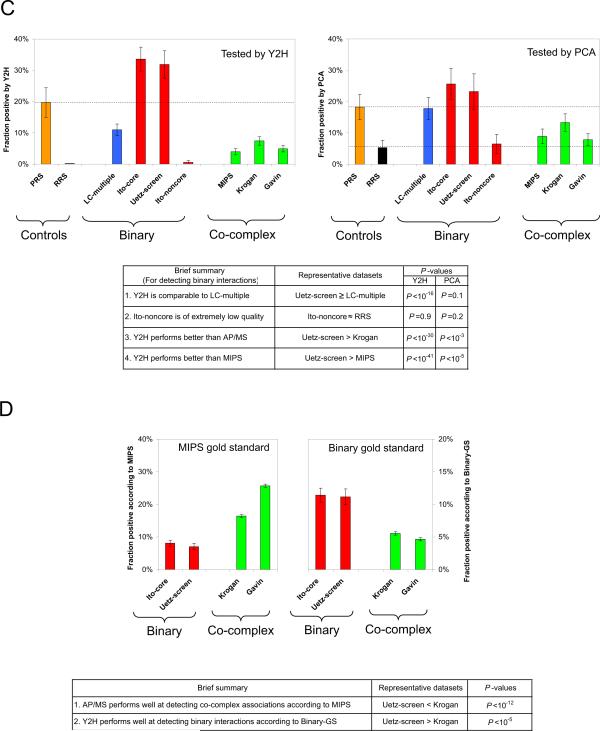
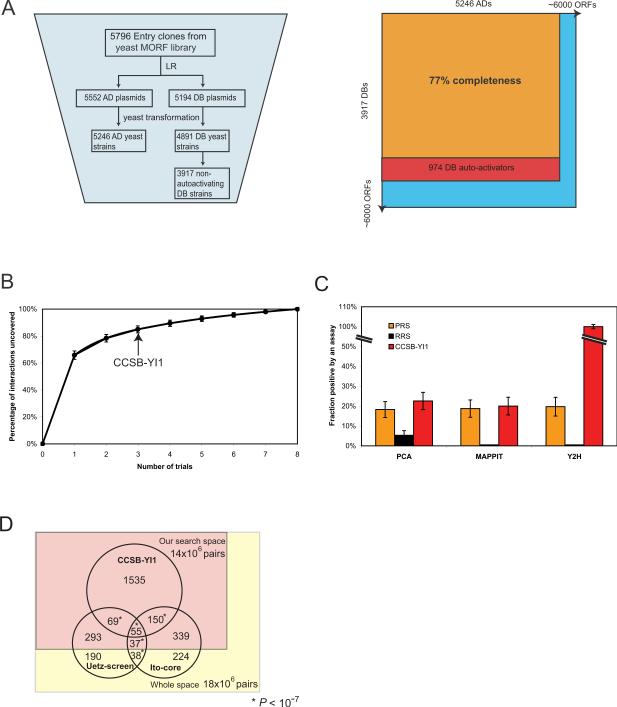
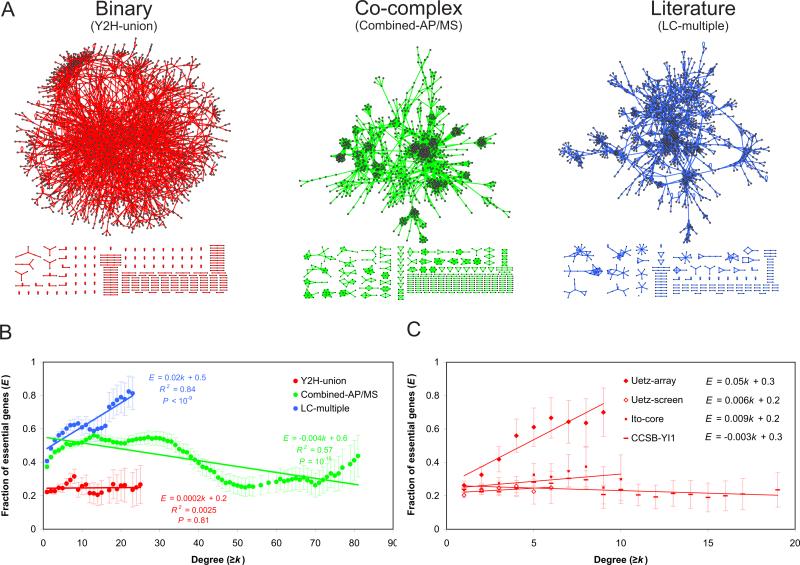
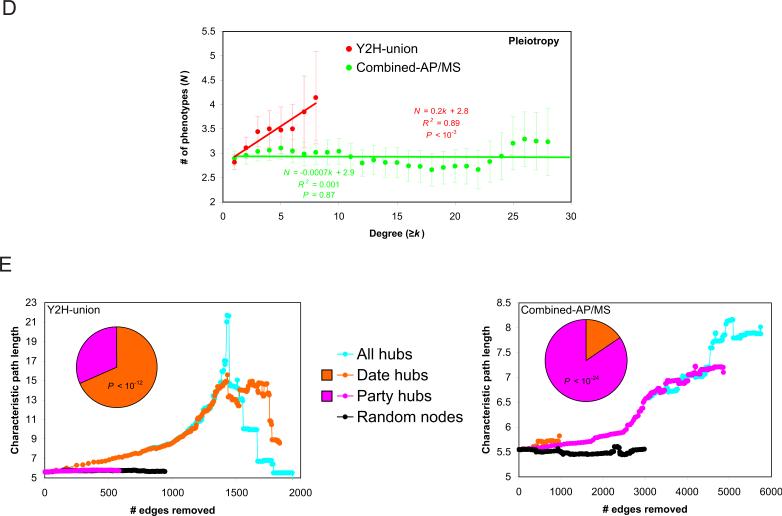
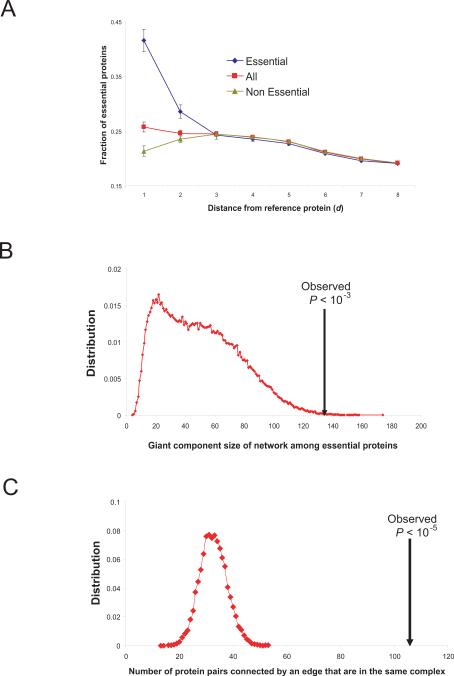
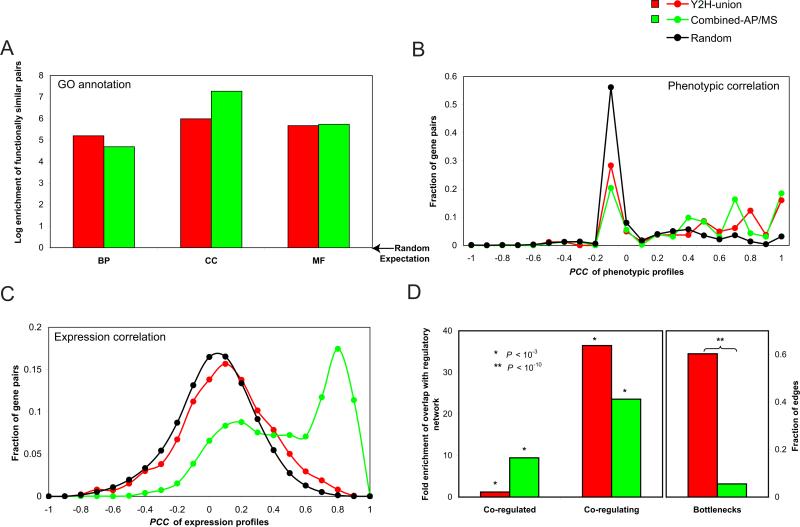
Current yeast interactome network maps contain several hundred molecular complexes with limited and somewhat controversial representation of direct binary interactions. We carried out a comparative quality assessment of current yeast interactome data sets, demonstrating that high-throughput yeast two-hybrid (Y2H) screening provides high-quality binary interaction information. Because a large fraction of the yeast binary interactome remains to be mapped, we developed an empirically controlled mapping framework to produce a "second-generation" high-quality, high-throughput Y2H data set covering approximately 20% of all yeast binary interactions. Both Y2H and affinity purification followed by mass spectrometry (AP/MS) data are of equally high quality but of a fundamentally different and complementary nature, resulting in networks with different topological and biological properties. Compared to co-complex interactome models, this binary map is enriched for transient signaling interactions and intercomplex connections with a highly significant clustering between essential proteins. Rather than correlating with essentiality, protein connectivity correlates with genetic pleiotropy.


Figures

Fig. 1
Fig. 1
Evaluation of S. cerevisiae protein-protein interaction datasets. (A) Number of interactions reported in various large-scale S. cerevisiae protein-protein interaction datasets. (B) Schema of pipeline used to assemble binary positive and random reference sets. (C) Fraction of a random sample of interactions from each dataset confirmed by Y2H and PCA. (D) Fraction of positives in each dataset calculated using MIPS and Binary-GS. (Error bars indicate standard error).
Fig. 1
Fig. 1
Evaluation of S. cerevisiae protein-protein interaction datasets. (A) Number of interactions reported in various large-scale S. cerevisiae protein-protein interaction datasets. (B) Schema of pipeline used to assemble binary positive and random reference sets. (C) Fraction of a random sample of interactions from each dataset confirmed by Y2H and PCA. (D) Fraction of positives in each dataset calculated using MIPS and Binary-GS. (Error bars indicate standard error).
Fig. 2
Fig. 2
Large-scale Y2H interactome screen. (A) Completeness of the Y2H screen. (B) Sampling-sensitivity of CCSB Y2H screens measured by screening a subspace multiple times. (C) Fraction of protein pairs in PRS, RRS, and CCSBYI1 that test positive by PCA, MAPPIT or Y2H. (D) Overlaps between three high-quality large-scale S. cerevisiae Y2H datasets (*P<10-7).
Fig. 3
Fig. 3
Network analysis of Y2H-union, Combined-AP/MS and LC-multiple datasets. (A) Network representations. Shown are relationships between increasing degree of a gene product and (B) the fraction of essential genes with the corresponding degree, (C) the fraction of essential genes with the corresponding degree for Y2H datasets, (D) the number of phenotypes associated with deletion of the encoding gene. (E) Contribution of date hubs and party hubs as measured by change in the characteristic path length after simulated removal of edges by deleting the indicated types of nodes. Inset: fraction of date hubs and party hubs for each dataset.
Fig. 3
Fig. 3
Network analysis of Y2H-union, Combined-AP/MS and LC-multiple datasets. (A) Network representations. Shown are relationships between increasing degree of a gene product and (B) the fraction of essential genes with the corresponding degree, (C) the fraction of essential genes with the corresponding degree for Y2H datasets, (D) the number of phenotypes associated with deletion of the encoding gene. (E) Contribution of date hubs and party hubs as measured by change in the characteristic path length after simulated removal of edges by deleting the indicated types of nodes. Inset: fraction of date hubs and party hubs for each dataset.
Fig. 4
Fig. 4
Clustering of essential proteins. (A) Average fraction of essential proteins among proteins whose distance are equal to d from a protein selected from essential, non-essential and all proteins. (B) Giant component size of network formed by essential proteins (arrow) compared to 100,000 random networks of same topological properties. (C) The number of interacting essential proteins that are also found in the same complex compared to 10,000 random selections of proteins of the same number as essential proteins (SOM IX).
Fig. 5
Fig. 5
Biological features of yeast interactome datasets. (A) Enrichment of interacting protein pairs (relative to random) that share GO annotations in the biological process, cellular component and molecular function branches of GO ontology. (B) Pearson correlation coefficient (PCC) of phenotypic profiles between interacting pairs in different datasets. (C) Co-expression correlation between interacting pairs. (D) Left panel: enrichment of interacting proteins as targets of a common TF (co-regulated), and enrichment of interacting TFs in a common MIM (co-regulating) (*P<10-3). Right panel: fraction of bottlenecks from each dataset in the combined network (SOM XI). Top 10% of edges with the highest betweenness are defined as “bottlenecks” (45).

Comment in

References

    1. Fromont-Racine M, Rain JC, Legrain P. Nat. Genet. 1997;16:277. - PubMed
    1. Uetz P, et al. Nature. 2000;403:623. - PubMed
    1. Ito T, et al. Proc. Natl. Acad. Sci. USA. 2001;98:4569. - PMC - PubMed
    1. Walhout AJ, et al. Science. 2000;287:116. - PubMed
    1. Reboul J, et al. Nat. Genet. 2003;34:35. - PubMed

Publication types

MeSH terms