. 2008 Jul-Aug;2(4):198-214.
doi: 10.4161/fly.6621.

The Drosophila protein palmitoylome: characterizing palmitoyl-thioesterases and DHHC palmitoyl-transferases

Affiliations

The Drosophila protein palmitoylome: characterizing palmitoyl-thioesterases and DHHC palmitoyl-transferases

Barbra A Bannan et al. Fly (Austin). 2008 Jul-Aug.

Abstract

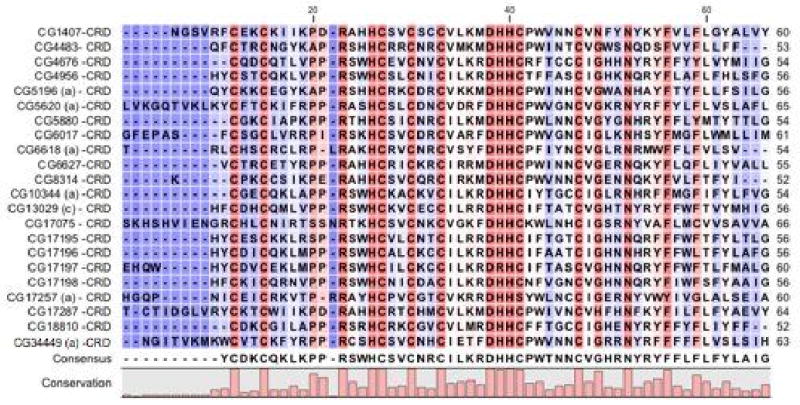
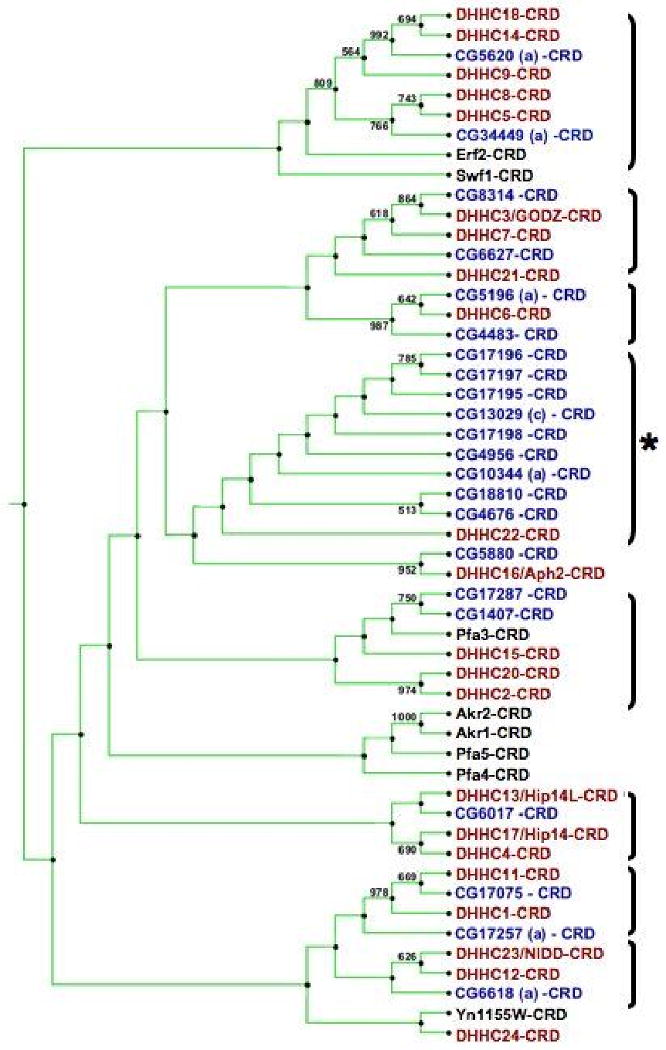
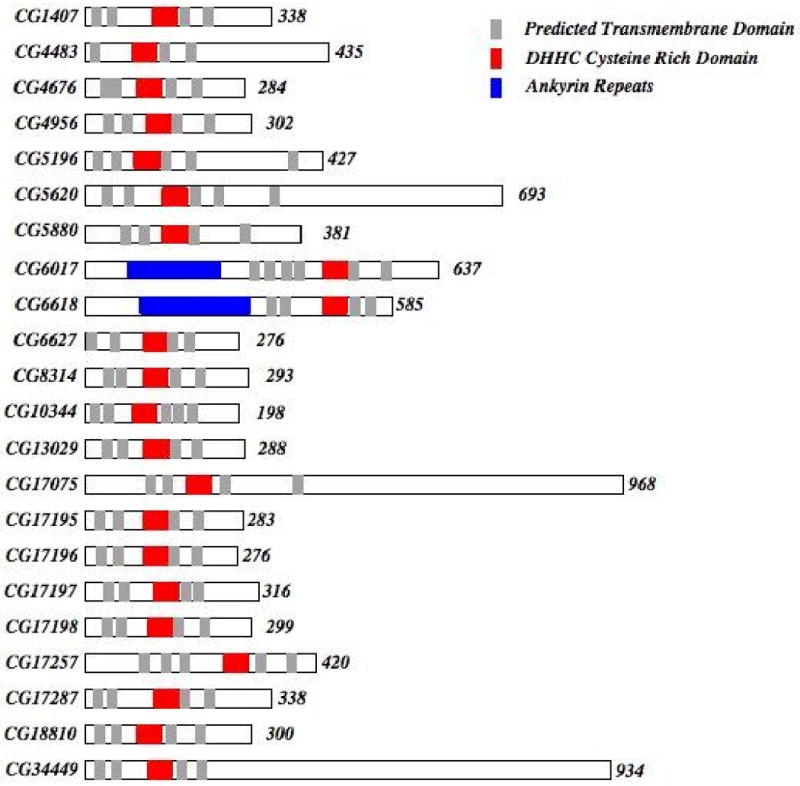
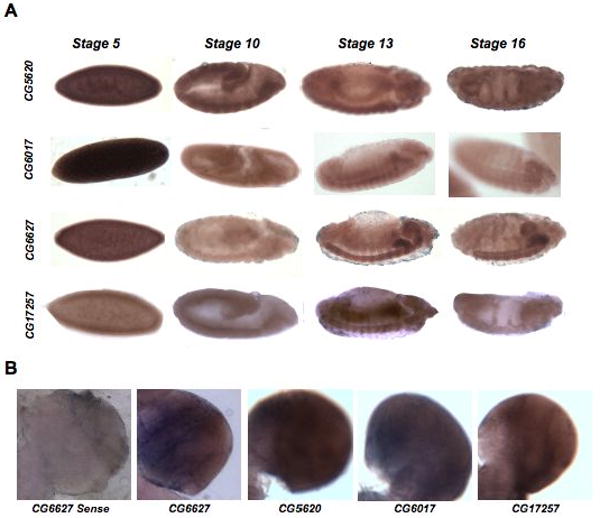
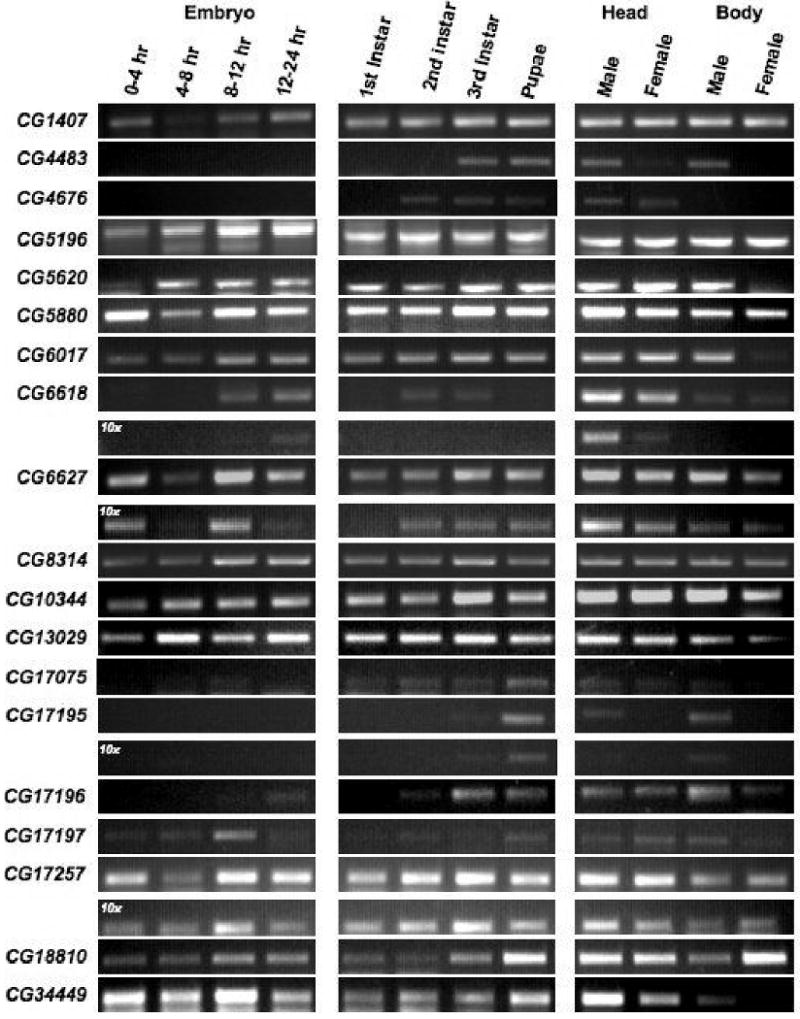
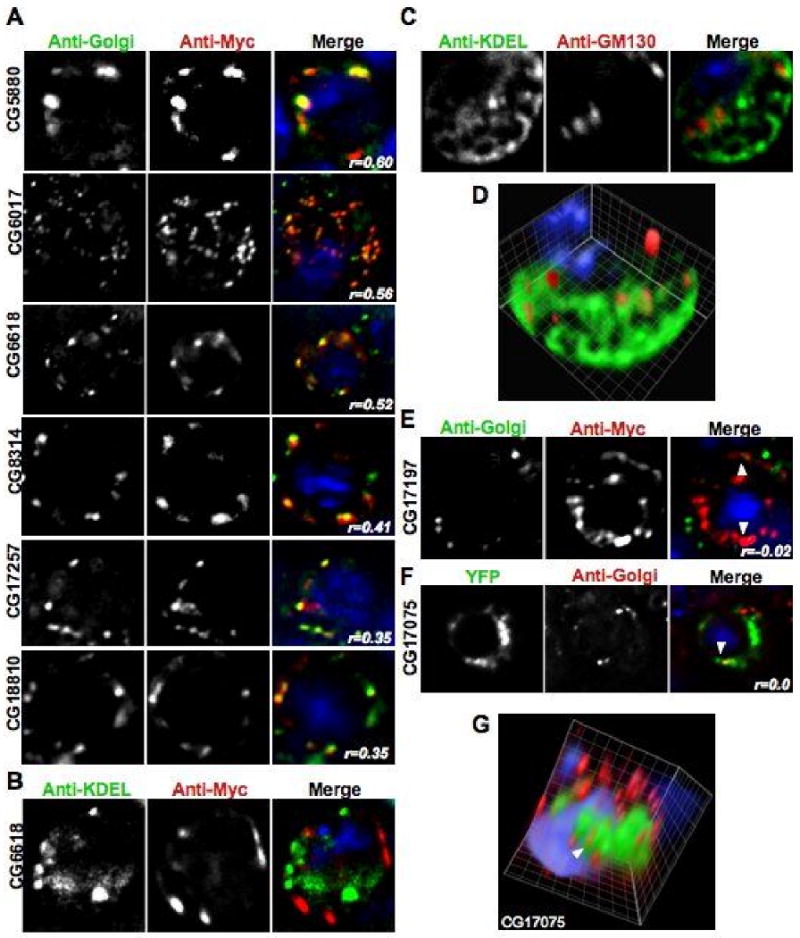
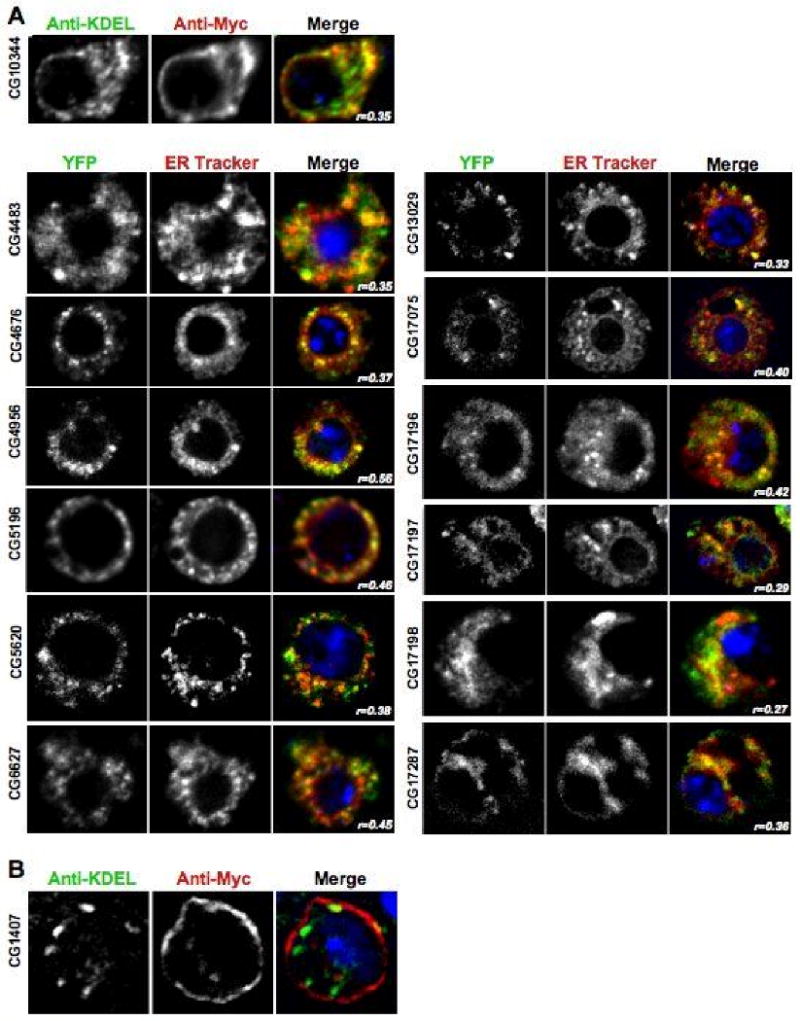
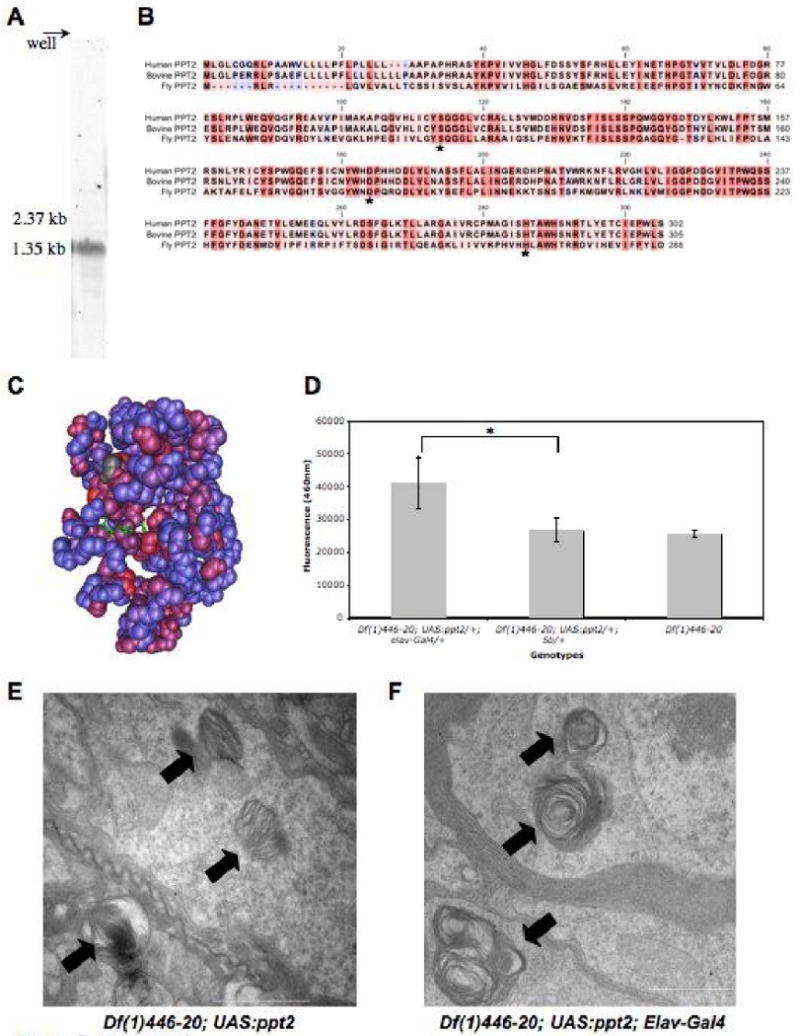
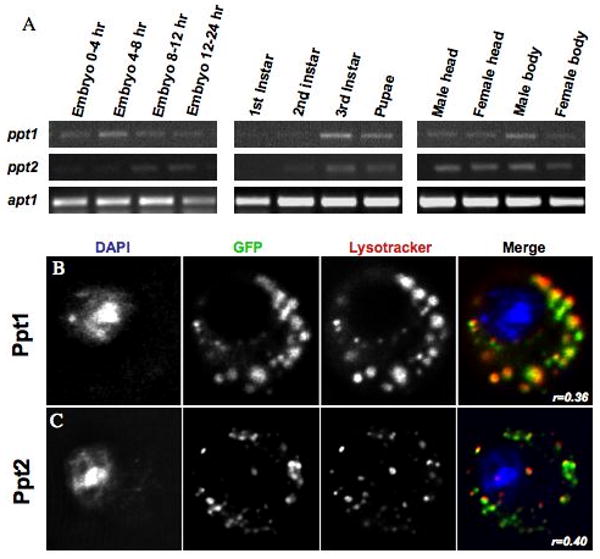
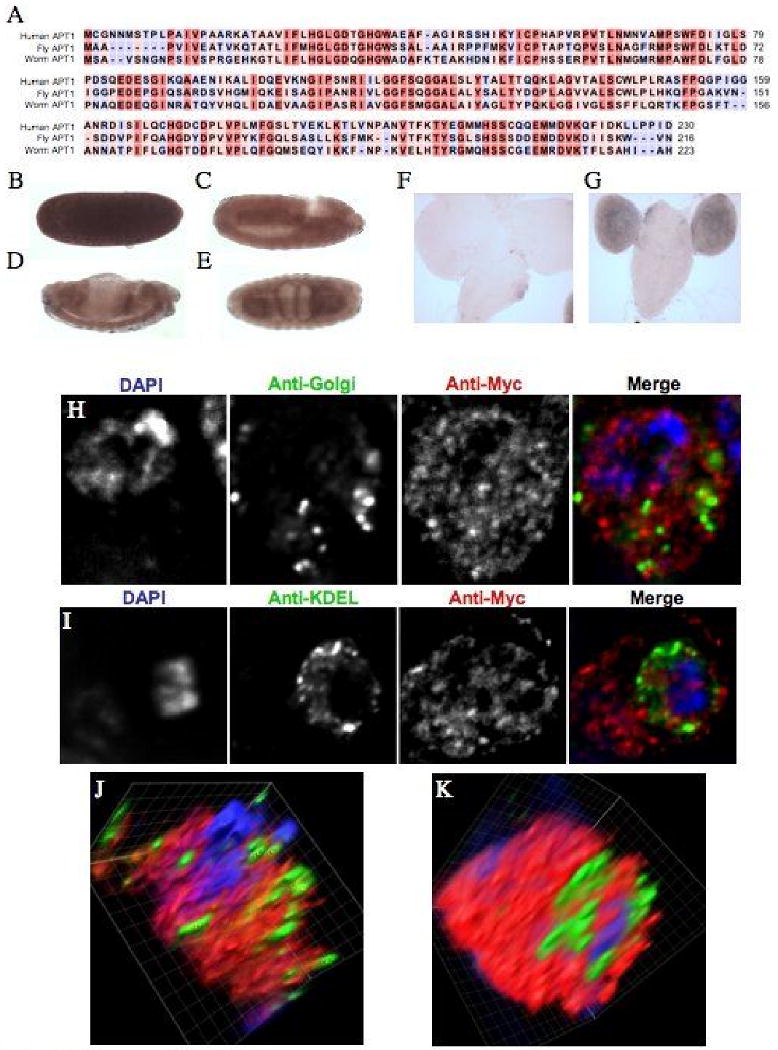
Palmitoylation is the post-translational addition of a palmitate moiety to a cysteine residue through a covalent thioester bond. The addition and removal of this modification is controlled by both palmitoyl acyl-transferases and thioesterases. Using bioinformatic analysis, we identified 22 DHHC family palmitoyl acyl-transferase homologs in the Drosophila genome. We used in situ hybridization,RT-PCR, and published FlyAtlas microarray data to characterize the expression patterns of all 22 fly homologs. Our results indicate that all are expressed genes, but several, including CG1407, CG4676, CG5620, CG6017/dHIP14, CG6618, CG6627 and CG17257 appear to be enriched in neural tissues suggesting that they are important for neural function. Furthermore, we have found that several may be expressed in a sex-specific manner with adult male specific expression of CG4483 and CG17195. Using tagged versions of the DHHC genes, we demonstrate that fly DHHC proteins are primarily located in either the Golgi Apparatus or Endoplasmic Reticulum in S2 cells, except for CG1407, which was found on the plasma membrane. We also characterized the subcellular localization and expression of the three known thioesterases: Palmitoyl-protein Thioesterase 1 (Ppt1), Palmitoyl-protein Thioesterase 2 (Ppt2)and Acyl-protein Thioesterase 1 (APT1). Our results indicate that Ppt1 and Ppt2 are the major lysosomal thioesterases while APT1 is the likely cytoplasmic thioesterase. Finally, in vivo rescue experiments show that Ppt2 expression cannot rescue the neural inclusion phenotypes associated with loss of Ppt1, further supporting distinct functions and substrates for these two thioesterases. These results will serve as the basis for a more complete understanding of the protein palmitoylome's normal cellular functions in the fly and will lead to further insights into the molecular etiology of diseases associated with the mis-regulation of palmitoylation.


Figures

Figure 1
Figure 1. Drosophila DHHC CRD alignment and Phylogenetic Analysis
A. A ClustalX alignment of the DHHC Cysteine Rich Domains (CRD) found in twenty-two identified Drosophila DHHC proteins. The DHHC domain was defined by the region that showed high homology to the consensus DHHC domain sequence (pfam01529) found in the pfam database. The amino acid residue's background color indicates the degree of conservation within the Drosophila DHHC CRD domains: red is highly conserved and blue indicates no conservation. The accession numbers for the proteins used in this analysis are: CG1407 (NP_724868), CG4483 (NP_648294), CG4676 (NP_610853), CG4856 (NP_651428), CG5196-PA (NP_650191), CG5620-PA (NP_648561), CG5880 (NP_651539), CG6017 (NP_648824), CG6627 (NP_477449), CG6618-PA (NP_723724), CG8314 (NP_611070), CG10344-PA (NP_726201), CG13029-PC (NP_648928), CG17075 (NP_608508), CG17195 (NP__651427), CG17196 (NP_651426), CG17197 (NP_651425), CG17198 (NP_651424), CG17257-PA (NP_722869), CG17287 (NP_611197), CG18810 (NP_652670), CG34449 (NP_727339). For proteins that have multiple isoforms, only one was used in the alignment. B. A phylogenetic tree of the 22 Drosophila proteins (labeled in blue), 23 human proteins (labeled in red) and 8 yeast proteins (labeled in black) made using nearest neighbor joining analysis on the CRD domain sequences. The Drosophila sequences used are shown in A. The human and yeast sequences were defined based on the analysis done in Mitchell et al. Brackets indicate possible subfamilies within the DHHC domain containing proteins. The asterisk indicates a subfamily that consists of Drosophila proteins that have a testes specific enrichment in the adult. The analysis was done with 1000 bootstraps and only those nodes with bootstrap values higher than 500 (50%) are indicated on the tree. The value is calculated by creating a new data set from a randomly chosen site in the original alignment to create a pseudoalignment. It represents the number of the 1000 bootstrap iterations that supported the branching relationship shown. Phylogenetic analysis was done with CLC Combined Workbench 2.
Figure 2
Figure 2. Drosophila DHHC family structural features
A schematic representation of all 22 identified DHHC domain proteins from N to C terminus showing protein size, conserved protein domains and putative transmembrane domains. The transmembrane domains were predicted using TMHMM (www.cbs.dtu.dk/services/TMHMM-2.0/). Only those transmembrane regions with a probability of 1 as defined by this prediction algorithm are shown. The predicted number of amino acids in each protein is indicated at the end of each protein.
Figure 3
Figure 3. Tissue-specific enrichment of palmitoylome genes
A. This figure catalogs distinct tissue-specific patterns of expression for several of the DHHC proteins as determined by in situ hybridization on mixed-stage Drosophila embryos. The anti-sense staining for four different DHHC genes at four stages of embryonic development is shown. Lateral views of a developmental expression series for each gene proceed from left to right across the figure. A ventral view is shown for the stage 16 CG5620 in situ. Anterior is to the right. Only the DHHC genes that showed obvious enrichment in particular tissues are presented. The rest of the in situ hybridization results are shown in Table 3. B. The anti-sense staining of 3rd instar larval brains for four different DHHC genes is shown. Each image is a close-up of one brain lobe. An example of a sense control for CG6627 is also shown.
Figure 4
Figure 4. Stage-specific RT-PCR expression panels
DHHC transferase developmental expression levels were assayed using gene-specific PCR primers on a panel of first-strand cDNA prepared from 12 Drosophila developmental stages/tissues. Those genes (CG4956, CG17198, and CG17287) that failed to give a signal are not shown. The primer sets used in this analysis are shown in Table 2. The 10-fold dilution series for several genes that gave stage or sex specific signals is also shown. This amplification series is labeled as 10×.
Figure 5
Figure 5. DHHC proteins localized to the Golgi
All of the panels show images acquired in each channel and then a merged view. The blue DAPI stain is only shown in the merged view. Unless otherwise noted, the images shown are one section of a deconvolved Z-stack through the cell. A. Representative images of transiently transfected S2 cells that were triple stained with DAPI, anti-Myc, and an anti-Golgi antibody. The Pearson's Correlation statistic (r) for the pixel intensity correlation between the red Myc channel and the anti-Golgi green channel is shown in the merge panel. B. A representative image of a transiently transfected S2 cell that was triple stained with DAPI, anti-Myc, and an anti-KDEL antibody showing a lack of co-localization between CG6618 and the ER marker. C. A representative image of an untransfected S2 cell that was triple stained with DAPI, the cis Golgi marker anti-GM130, and an anti-KDEL antibody showing that the Golgi and ER compartments can be visually separated in S2 cells. D. A volume view produced from a deconvolved Z-stack of the cell shown in C that shows compartment separation in a single S2 cell. E. A representative image of a S2 cell transiently transfected with a CG17197-6×Myc construct. The cell was triple stained with DAPI, an anti-Golgi antibody, and anti-Myc antibody to show that the ER-localized CG17197 is distinct from the anti-Golgi marker. Arrowheads label areas of close association of the two signals. F. A representative image of a S2 cell transiently transfected with a CG17075-YFP construct. The cell was stained with DAPI, and an anti-Golgi antibody to show that the ER-localized CG17075 is distinct from the anti-Golgi marker. An arrowhead labels an area of close association of the two signals. G. A volume view produced from a deconvolved Z-stack of the cell shown in F. An arrowhead labels the same area of close association that is shown in panel F. The volume reconstruction demonstrates that the Golgi signal is distinct from the ER-localized CG17075-YFP protein.
Figure 6
Figure 6. DHHC proteins localized to the ER and the Plasma Membrane
A. Representative images of transiently transfected S2 cells that were triple stained with DAPI, anti-Myc, and an anti-KDEL antibody or cells imaged with DAPI, YFP, and ER-Tracker Red. The panel for each DHHC gene shows the image acquired in each channel and then a merged view. The blue DAPI stain is only shown in the merged view. The images shown are one section of a deconvolved Z-stack through the cell. The Pearson's Correlation statistic (r) for the pixel intensity correlation between the green channel and the red channel is shown in the merge panel. B. Representative image of a S2 cell transiently transfected with a CG1407-6×Myc construct that was triple stained with DAPI, anti-Myc, and an anti-KDEL antibody to demonstrate the plasma membrane localization of the protein. The panel shows the image acquired in each channel and then a merged view. The blue DAPI stain is only shown in the merged view. The image shows one section of a deconvolved Z-stack through the cell.
Figure 7
Figure 7. The Drosophila PPT2 homolog
A. A northern blot of adult total RNA showing the ∼1.5kb transcript highlighted by a Ppt2 specific riboprobe. B. Sequence alignment of human, bovine, and fly PPT2 amino acid sequence generated with ClustalX. The amino acid residue's background color indicates the degree of conservation between the proteins: red is highly conserved and blue indicates no conservation. The conserved catalytic triad is indicated with an asterisk. C. Drosophila sequence conservation was mapped onto the PPT2 bovine crystal structure using Cn3D (NCBI). The crystal structure shows conserved regions in red, non-conserved regions in blue, and the conserved catalytic triad in green. D. A graph demonstrating that Ppt2 over-expression in a Ppt1 null background produces significant (*=p<0.0002, t-test) cleavage activity of the PPT1 substrate, 4MU-6S-palm-β-Glc. PPT2 enzyme activity was measured as the mean total fluorescence emitted at 460nm per head.E. Transmission electron micrograph (TEM) image of a Df(1)446-20; UAS:ppt2/+ brain showing inclusions of abnormal storage material. Laminar deposits typical of Ppt1 mutants are indicated with an arrow. F. TEM images of Df(1)446-20; UAS:ppt2/+; Elav-Gal4/+ brains show similar deposits (arrows). Scale bars are 1μm.
Figure 8
Figure 8. Expression and localization of the Drosophila thioesterases, Ppt1 and Ppt2
A. Thioesterase developmental expression levels were assayed using gene-specific PCR primers on a panel of first-strand cDNA prepared from 12 Drosophila tissues and developmental stages. B. Live cell imaging of an S2 cell transiently transfected with a GFP-Ppt1 fusion protein. Cells were co-stained with Lysotracker-red and DAPI. C. Live cell imaging of an S2 cell transiently transfected with a Ppt2-YFP fusion protein. Cells were co-stained with Lysotracker-red and DAPI. The Pearson's Correlation statistic (r) for the pixel intensity correlation between the GFP channel and the Lysotracker Red channel is shown in the merge panel.
Figure 9
Figure 9. CG18815 thioesterase is the putative Drosophila APT1 ortholog
A. Sequence alignment of the human, Drosophila, C. elegans APT1 amino acid sequence generated with ClustalX. The amino acid residue's background color indicates the degree of conservation between the proteins: red is highly conserved and blue indicates no conservation. B-E. The anti-sense staining for CG18815 at four stages of embryonic development is shown. B. Stage 5. C. Stage 10. D. Stage 13. E. Stage 16. Lateral views of a developmental expression series are shown except for the ventral view that is shown for the stage 16 CG18815 in situ. Anterior is to the right. F. A sense probe image of a 3rd instar larval brain CG18815 in situ. G. An image showing specific brain lobe staining in 3rd instar larvae for the CG18815 anti-sense probe. H. Images of fixed S2 cells transiently transfected with a CG18815-6×Myc fusion protein and co-stained with DAPI and an anti-Golgi antibody. I. Images of fixed S2 cells transiently transfected with a CG18815-Myc fusion protein and co-stained with DAPI and an anti-KDEL antibody to mark the ER. J. A volume view produced from a deconvolved Z-stack of the cell shown in C. K. A volume view produced from a deconvolved Z-stack of the cell shown in D.

References

    1. Nadolski MJ, Linder ME. Protein lipidation. FEBS Journal. 2007;274:5202–5010. - PubMed
    1. Mitchell DA, Vasudevan A, Linder ME, Duchenes RJ. Protein palmitoylation by a family of DHHC protein S-acyltransferases. J Lipid Res. 2006;47:1118–1127. - PubMed
    1. Linder ME, Deschenes RJ. Model organisms lead the way to protein palmitoyltransferases. J Cell Sci. 2004;117:521–526. - PubMed
    1. Chamoun Z, Mann RK, Nellen D, von Kessler DP, Bellotto M, Beachy PA, Basler K. Skinny Hedgehog, an Acyltransferase Required for Palmitoylation and Activity of the Hedgehog Signal. Science. 2001;293:2080–2084. - PubMed
    1. Zhai L, Chaturvedi D, Cumberledge S. Drosophila wnt-1 undergoes a hydrophobic modification and is targeted to lipid rafts, a process that requires porcupine. J Cell Biol. 2004;279:33220–33227. - PubMed

Publication types

MeSH terms