. 2008 Nov 1;511(1):1-18.
doi: 10.1002/cne.21811.

A quantitative study of spinothalamic neurons in laminae I, III, and IV in lumbar and cervical segments of the rat spinal cord

Affiliations

A quantitative study of spinothalamic neurons in laminae I, III, and IV in lumbar and cervical segments of the rat spinal cord

Khulood M Al-Khater et al. J Comp Neurol. .

Abstract

The major ascending outputs from superficial spinal dorsal horn consist of projection neurons in lamina I, together with neurons in laminae III-IV that express the neurokinin 1 receptor (NK1r) and have dendrites that enter the superficial laminae. Some neurons in each of these populations belong to the spinothalamic tract, which conveys nociceptive information via the thalamus to cortical areas involved in pain. A projection from the cervical superficial dorsal horn to the posterior triangular nucleus (PoT) has recently been identified. PoT is at the caudal end of the thalamus and was not included in injection sites in many previous retrograde tracing studies. We have injected various tracers (cholera toxin B subunit, Fluoro-Gold, and fluorescent latex microspheres) into the thalamus to estimate the number of spinothalamic neurons in each of these two populations, and to investigate their projection targets. Most lamina I and lamina III/IV NK1r-immunoreactive spinothalamic neurons in cervical and lumbar segments could be labeled from injections centered on PoT. Our results suggest that there are 90 lamina I spinothalamic neurons per side in C7 and 15 in L4 and that some of those in C7 only project to PoT. We found that 85% of the lamina III/IV NK1r-immunoreactive neurons in C6 and 17% of those in L5 belong to the spinothalamic tract, and these apparently project exclusively to the caudal thalamus, including PoT. Because PoT projects to second somatosensory and insular cortices, our results suggest that these are major targets for information conveyed by both these populations of spinothalamic neurons.


Figures
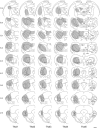
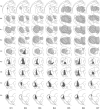
Figure 1
Figure 1
Injection sites for experiments Thal1–Thal5. Drawings show the spread of Fluoro-Gold (shaded area) in these experiments. Each vertical column represents a single experiment, and the experiment number (corresponding to those in Tables 1, 2, and 5) is shown at the bottom of the column. Numbers at the top left of each drawing give the approximate position of the section anterior to the interaural plane. Drawings are based on those in Paxinos and Watson (2005). AM, anteromedial thalamic nucleus; APT, anterior pretectal nucleus; AV, anteroventral thalamic nucleus; CL, centrolateral thalamic nucleus; CM, central medial thalamic nucleus; fr, fasciculus retroflexus; IAM, interanteromedial thalamic nucleus; ic, internal capsule; LD, laterodorsal thalamic nucleus; LG, lateral geniculate nucleus; LP, lateral posterior thalamic nucleus; MD, mediodorsal thalamic nucleus; MG, medial geniculate nucleus; PC, paracentral thalamic nucleus; PF, parafascicular thalamic nucleus; PIL, posterior intralaminar thalamic nucleus; Po, posterior thalamic nuclear group; PoT, posterior thalamic nuclear group, triangular part; PP, peripeduncular nucleus; Re, reuniens thalamic nucleus; RRE, retrouniens area; Rt, reticular thalamic nucleus; Sub, submedius thalamic nucleus; SubB, subbrachial nucleus; VA, ventral anterior thalamic nucleus; VL, ventrolateral thalamic nucleus; VM, ventromedial thalamic nucleus VPL, ventral posterolateral thalamic nucleus; VPM, ventral posteromedial thalamic nucleus; VPPC, ventral posterior thalamic nucleus, parvicellular part. Scale bar = 1 mm (also applies to Figs. 2 and 3).
Figure 2
Figure 2
Injection sites for experiments PoT1–PoT10. Drawings show the spread of CTb (dark shading) or Fluoro-Gold (light shading) in these experiments. Each column represents a single experiment, and the experiment number (corresponding to those in Tables 1, 3, and 6) is shown at the bottom of the column. Numbers at the top left of each drawing give the approximate position of the section anterior to the interaural plane. Drawings are based on those in Paxinos and Watson (2005). Abbreviations as in Figure 1.
Figure 3
Figure 3
Injection sites for experiments DI1–DI7. Drawings show the spread of Fluoro-Gold (light shading) and CTb (dark shading) in these experiments. Each vertical column represents a single experiment, and the experiment number (corresponding to those in Tables 1, 4, and 7) is shown at the bottom of the column. Numbers at the top left of each drawing give the approximate position of the section anterior to the interaural plane. Drawings are based on those in Paxinos and Watson (2005). For labeling of structures shown within these drawings, see Figure 1.
Figure 4
Figure 4
Examples of CTb and Fluoro-Gold injection sites. a: A section (interaural ∼3.8 mm) through an injection of CTb that was targeted on the PoT nucleus (experiment DI1). The section was reacted with an immunoperoxidase method to reveal CTb. b, c: Brightfield and fluorescence micrographs of a section (interaural ∼5.2 mm) through part of a Fluoro-Gold injection site (experiment DI7). Note the necrotic center and the spread of Fluoro-Gold fluorescence from this region. 3V, 3rd ventricle; ml, medial lemniscus; other abbreviations as in Figure 1. Scale bar = 1 mm in c (applies to all).
Figure 5
Figure 5
Identification of lamina I in transverse sections of C7. a: Darkfield photomicrograph of the C7 segment from experiment Thal5. The continuous white line outlines the gray matter, and the two dashed lines show the limits of the dark band that corresponds to lamina II. Note that lamina I is wider in the central part of the dorsal horn than in the lateral or medial parts. b: The same section scanned to reveal NK1r-immunoreactivity. The plexus of strongly immunoreactive profiles that occupies lamina I is also wider in the central part of the dorsal horn, and its dorsoventral extent closely matches the region defined as lamina I with darkfield microscopy. The confocal image in b is a projection of six optical sections at 4-μm z-spacing. Scale bar = 100 μm in b (applies to a,b).
Figure 6
Figure 6
Plots of the locations of spinothalamic tract neurons at cervical and lumbar levels. These drawings show the location of all retrogradely labeled cells identified in the upper part of the dorsal horn in the transverse sections that were used for quantitative analysis in experiment Thal1. Each symbol represents a single neuron. The two thin lines indicate the dorsal and ventral borders of lamina II, which were determined from darkfield micrographs. The drawing on the left shows the cells seen in 10 randomly selected 60-μm sections through the C7 segment, whereas the drawing on the right represents the cells in 20 such sections from the L4 segment.
Figure 7
Figure 7
Retrograde labeling of lamina I spinothalamic tract neurons with CTb and Fluoro-Gold. The main part of the figure shows part of lamina I in a transverse section from the C7 segment of experiment DI3 immunostained to reveal CTb (green) and Fluoro-Gold (FG; magenta). A merged image is shown on the right. Several retrogradely labeled lamina I cells are present in this field. Two of these (arrows) contain both CTb and Fluoro-Gold, and others (two of which are indicated with arrowheads) are labeled with CTb but not Fluoro-Gold. The inset shows a single lamina I neuron in a transverse section from the L4 segment of experiment DI5 that was labeled with both CTb and Fluoro-Gold. The images were obtained from a projection of 19 (main part) or 18 (inset) confocal optical sections at 1-μm z-spacing. Scale bar = 20 μm in far right panel (applies to all).
Figure 8
Figure 8
A lamina I spinothalamic neuron with NK1r. a: A transverse section through the medial part of lamina I in the C7 segment of experiment Thal3 scanned to reveal NeuN (red) and DAPI (blue). Neuronal nuclei contain both NeuN and DAPI and therefore appear magenta, whereas nonneuronal nuclei are blue. b: The same field scanned to reveal NK1r (green) and Fluoro-Gold (FG; magenta). The continuous and dashed lines show the upper and lower borders of lamina I, respectively. The arrow indicates a retrogradely labeled neuron in lamina I, which is also NK1r-immunoreactive. Two other NK1r-immunoreactive neurons that are not retrogradely labeled are shown with asterisks, and several neurons that are NK1r-negative and lack Fluoro-Gold are also present in lamina I. The upper inset shows DAPI staining in the nucleus of the spinothalamic neuron, and the lower inset shows the NK1r on its surface membrane. All images are projections of two optical sections at 1-μm z-spacing. Scale bar = 20 μm in b (applies to a,b).
Figure 9
Figure 9
Lamina III NK1r-expressing spinothalamic neurons in parasagittal sections. a: A retrogradely labeled neuron in the C6 segment from experiment PoT7; b: A retrogradely labeled neuron in L5 from experiment DI6. In each case, CTb is shown in magenta and NK1r in green, and the dorsal limit of the dorsal horn is near the top of the field. Note that both of the labeled neurons have extensive dorsal dendrites that pass through the superficial dorsal horn. Images built from projections of 36 (a) or 60 (b) confocal optical sections at 1-μm z-spacing. Scale bar = 20 μm in b (applies to a,b).
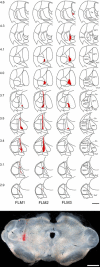
Figure 10
Figure 10
Injection sites for experiments FLM1-FLM3. Drawings show the spread of fluorescent latex microspheres (red) in these experiments. Each column represents a single experiment, and the experiment number (corresponding to those in Tables 1 and 8) is shown at the bottom of the column. Numbers at the top left of each drawing give the approximate position of the section anterior to the interaural plane. Drawings are based on those in Paxinos and Watson (2005). Eth, ethmoid thalamic nucleus; MGD, medial geniculate nucleus, dorsal part; MGV, medial geniculate nucleus, ventral part; other abbreviations as in Figure 1. The image below shows a darkfield photomicrograph (interaural ∼3.9 mm) from experiment FLM3. Note the limited spread of the red fluorescent latex microspheres. Scale bar = 1 mm in top and bottom panels.
Figure 11
Figure 11
Retrograde labeling of lamina I neurons with fluorescent latex microspheres in parasagittal sections. The top row of images shows an example of a labeled lamina I neuron from C6 in experiment FLM3, and the bottom row shows a labeled neuron in L5 from experiment FLM2. In each case, separate images show the fluorescent latex microspheres (beads, red), NK1r (green) and NeuN (blue), with a merged image on the right. Note the presence of numerous beads in each neuron and that both neurons are NK1r-immunoreactive (arrow). Images are projections of seven (top row) or five (bottom row) confocal optical sections at 1-μm z-spacing. Scale bar = 20 μm in bottom right panel (applies to all).
Figure 12
Figure 12
Retrograde labeling of NK1r-expressing neurons in lamina III with fluorescent latex microspheres in parasagittal sections. a,b: NK1r-immunoreactive lamina III cells in C6 (a) and L5 (b) from experiment FLM3. In each case, the soma is marked with an asterisk, and dorsal dendrites (arrowheads) can be seen passing into the superficial dorsal horn. a′, b′: The region of the soma of each cell scanned to reveal fluorescent latex microspheres (magenta) and NK1r (green), together with a merged image. Note the presence of numerous microspheres in the soma of each cell. a is a projection of 14 confocal optical sections at 1-μm z-spacing, and b is a montage of two fields projected from 14 and 9 optical sections at the same spacing. a′ and b′ are projections of 6 and 11 optical sections at 1-μm z-spacing, respectively. Scale bar = 20 μm in b (applies to a,b).

Similar articles

Cited by

References

    1. Akintunde A, Buxton DF. Quadruple labeling of brain-stem neurons: a multiple retrograde fluorescent tracer study of axonal collateralization. J Neurosci Methods. 1992;45:15–22. - PubMed
    1. Apkarian AV, Hodge CJ. Primate spinothalamic pathways: I. A quantitative study of the cells of origin of the spinothalamic pathway. J Comp Neurol. 1989;288:447–473. - PubMed
    1. Bester H, Chapman V, Besson JM, Bernard JF. Physiological properties of the lamina I spinoparabrachial neurons in the rat. J Neurophysiol. 2000;83:2239–2259. - PubMed
    1. Bice TN, Beal JA. Quantitative and neurogenic analysis of the total population and subpopulations of neurons defined by axon projection in the superficial dorsal horn of the rat lumbar spinal cord. J Comp Neurol. 1997;388:550–564. - PubMed
    1. Brown JL, Liu H, Maggio JE, Vigna SR, Mantyh PW, Basbaum AI. Morphological characterization of substance P receptor-immunoreactive neurons in the rat spinal cord and trigeminal nucleus caudalis. J Comp Neurol. 1995;356:327–344. - PubMed

Publication types

Substances