Comparative Study
. 2008 Aug 22:9:397.
doi: 10.1186/1471-2164-9-397.

Differential screening identifies transcripts with depot-dependent expression in white adipose tissues

Affiliations
Comparative Study

Differential screening identifies transcripts with depot-dependent expression in white adipose tissues

Yu Wu et al. BMC Genomics. .

Abstract

Background: The co-morbidities of obesity are tied to location of excess fat in the intra-abdominal as compared to subcutaneous white adipose tissue (WAT) depot. Genes distinctly expressed in WAT depots may impart depot-dependent physiological functions. To identify such genes, we prepared subtractive cDNA libraries from murine subcutaneous (SC) or intra-abdominal epididymal (EP) white adipocytes.

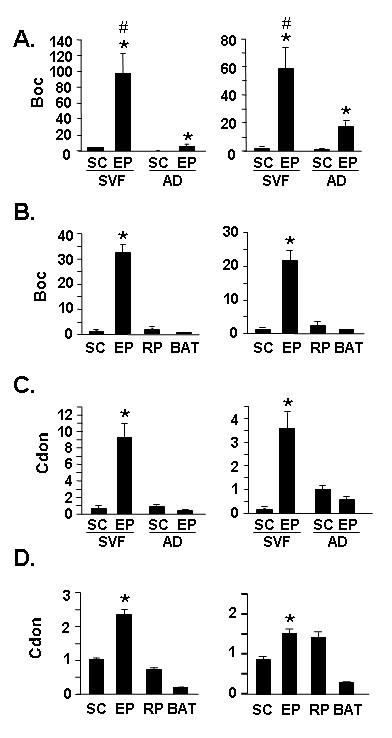
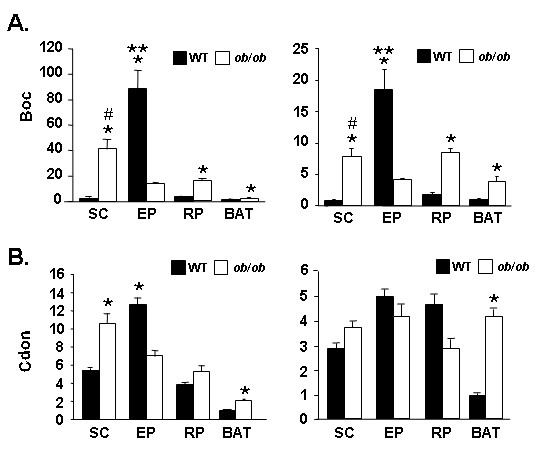
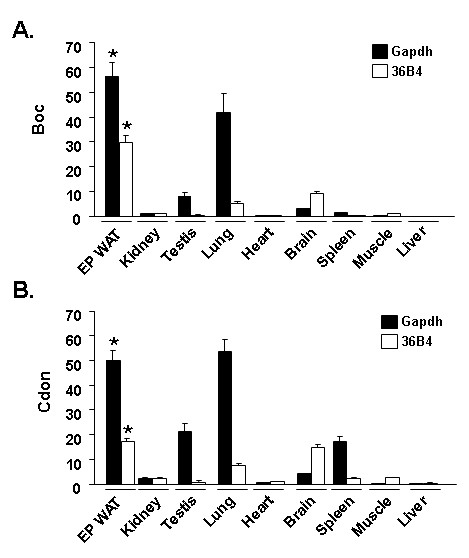
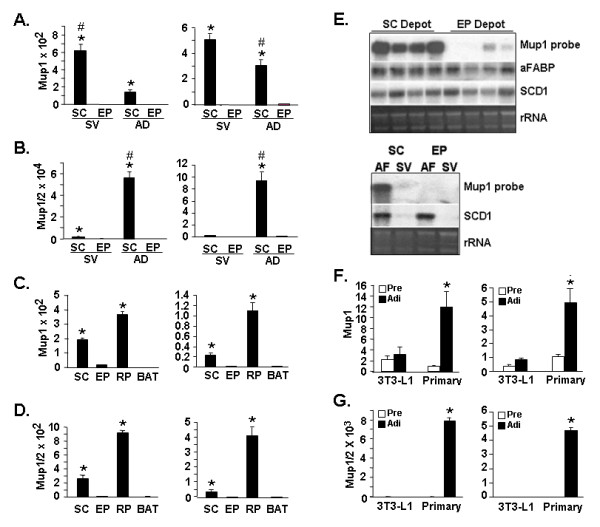
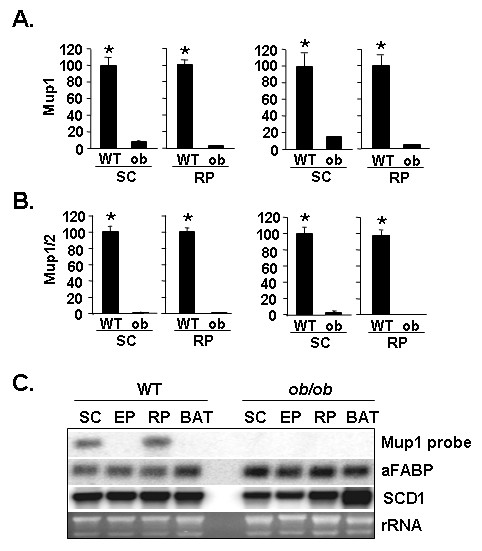
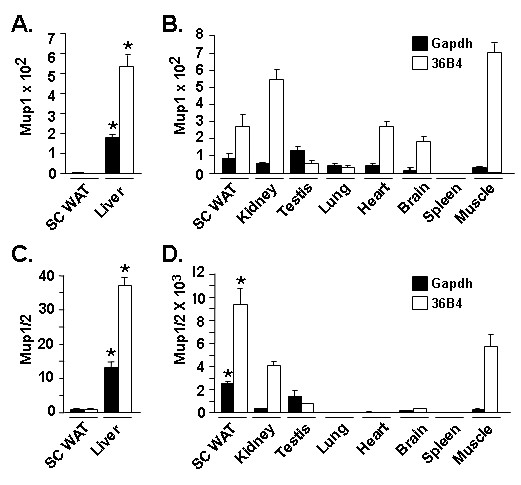
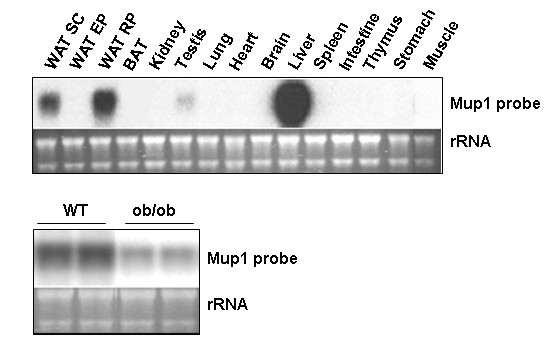
Results: Differential screening and qPCR validation identified 7 transcripts with 2.5-fold or greater enrichment in EP vs. SC adipocytes. Boc, a component of the hedgehog signaling pathway demonstrated highest enrichment (approximately 12-fold) in EP adipocytes. We also identified a dramatic enrichment in SC adipocytes vs. EP adipocytes and in SC WAT vs. EP WAT for transcript(s) for the major urinary proteins (Mups), small secreted proteins with pheromone functions that are members of the lipocalin family. Expression of Boc and Mup transcript was further assessed in murine tissues, adipogenesis models, and obesity. qPCR analysis reveals that EP WAT is a major site of expression of Boc transcript. Furthermore, Boc transcript expression decreased in obese EP WAT with a concomitant upregulation of Boc transcript in the obese SC WAT depot. Assessment of the Boc binding partner Cdon in adipose tissue and cell fractions thereof, revealed transcript expression similar to Boc; suggestive of a role for the Boc-Cdon axis in WAT depot function. Mup transcripts were predominantly expressed in liver and in the SC and RP WAT depots and increased several thousand-fold during differentiation of primary murine preadipocytes to adipocytes. Mup transcripts were also markedly reduced in SC WAT and liver of ob/ob genetically obese mice compared to wild type.

Conclusion: Further assessment of WAT depot-enriched transcripts may uncover distinctions in WAT depot gene expression that illuminate the physiological impact of regional adiposity.


Figures

Figure 1
Figure 1
Expression of transcripts for hedgehog signaling components Boc and Cdon in adipose depots. A. qPCR assessment of transcript levels in SVF and AD fractions of SC and EP WAT using the Boc primer set. B. qPCR assessment of Boc transcript in whole SC, EP, RP or BAT adipose tissue. C. qPCR assessment of transcript levels in SVF and AD of SC and EP WAT using the Cdon primer set. D. qPCR assessment of Cdon transcript in whole SC, EP, RP or BAT adipose tissue. For A-D, the left panels show data corrected against Gapdh and the right panels show data corrected against 36B4 as internal control for qPCR analysis; values stated in the text are the average of the Gapdh-corrected and 36B4-corrected data for each comparison. In A and B, the level in SC AD was set to a value of 1. SVF, stromal vascular fraction; AD, adipocyte fraction. In B and D, the level in SC WAT was set to a value of 1. For A, * indicates p < 0.001 for EP SVF vs. SC SVF and for EP AD vs. SC AD and # indicates p < 0.001 for EP SVF vs. all others (both panels). For B, * indicates p < 0.001 for EP vs. all others. For C, * indicates p < 0.001 for EP SVF vs. all others (both panels). For D, * indicates p < 0.001 for EP vs. all others (left panel) and EP vs. SC and BAT (right panel).
Figure 2
Figure 2
Expression of Boc and Cdon transcript in wild type and ob/ob tissues. qPCR assessment of transcript level in wild type C57Bl/6J (WT) and ob/ob SC WAT, EP WAT, RP WAT and BAT depots using the Boc primer set (A) and the Cdon primer set (B). For A and B, the left panels show data corrected against Gapdh and the right panels show data corrected against 36B4 as internal control for qPCR analysis; values stated in the text are the average of the Gapdh-corrected and 36B4-corrected data for each comparison. The level in WT BAT was set to a value of 1. For A, * indicates p < 0.001 for comparisons of WT vs. ob/ob samples for each of SC, EP, RP and BAT and # indicates p < 0.005 for ob/ob SC vs. all other ob/ob samples, and **, P < 0.005 for WT EP vs. all other samples (both panels). For B, * indicates p < 0.001 for WT vs. ob/ob BAT WT (both panels) and for WT vs. ob/ob for SC and EP depots left panel only.
Figure 3
Figure 3
Tissue distribution of Boc and Cdon transcript expression. qPCR analysis using the Boc (A) or the Cdon (B) primer set. For A and B, data was corrected against Gapdh (black fill) and or 36B4 (white fill) as internal control for qPCR analysis; values stated in the text are the average of the Gapdh-corrected and 36B4-corrected data for each comparison. For A, * indicates p < 0.001 for EP WAT compared with all tissues except the Gapdh-corrected value for lung. For B, * indicates p < 0.001 for EP WAT compared with all tissues except the Gapdh-corrected value for lung and the 36B4-corrected value for brain. For A and B, the level in kidney was set to a value of 1.
Figure 4
Figure 4
Differential enrichment of Mup transcripts in the SC WAT depot. A. qPCR assessment of transcript levels in SVF and AD fractions of SC and EP WAT using the Mup1 primer set. SVF, stromal vascular fraction; AD, adipocyte fraction. B. qPCR assessment of transcript levels in SVF and AD of SC and EP WAT using the Mup1/2 primer set. C. qPCR assessment of whole SC, EP, RP or BAT adipose tissue using the Mup1 primer set. D. qPCR assessment of whole SC, EP, RP or BAT adipose tissue using the Mup1/2 primer set. For A the EP SVF signal level was set to a value of 1 and for B the EP AF signal was set to 1. For A, * indicates p < 0.001 for SC SVF vs. EP SVF and for SC AD vs. EP AD, and # indicates p < 0.01 for SC SVF vs. all others. For B, * indicates p < 0.001 for SC SVF vs. EP SVF and for SC AD vs. EP AD, and # indicates p < 0.001 for SC AD vs. all others. For C and D the signal level in BAT was set to 1 and * indicates p < 0.001 for SC or RP compared with EP and with BAT. E. Upper panel shows Northern blot analysis of depot-dependent gene expression in either SC WAT or EP WAT depots of four individual male C57Bl/6J mice using 32P dATP-labeled Mup1, aFABP or SCD1 hybridization probes. Lanes 1–4 and lanes 5–8 represent SC and EP WAT tissue from mouse #1, #2, #3 and #4, respectively. Lower panel shows Northern blot analysis of fractionated SC and EP WAT. SV, stromal vascular fraction; AF, adipocyte fraction. Ethidium bromide staining of rRNA is shown as gel loading control. F. and G. qPCR assessment for 3T3-L1 or primary cultures of preadipocytes (Pre) and adipocytes (Adi) using the Mup1 (F) or the Mup1/2 (G) primer sets. The level of transcript expression in primary preadipocytes was set to a value of 1. For F and G, * indicates p < 0.001 for primary adipocytes vs. all others. For A-D, F and G, the left panels show data corrected against Gapdh and the right panels show data corrected against 36B4 as internal control for qPCR analysis; values stated in the text are the average of the Gapdh and 36B4-corrected data for each comparison.
Figure 5
Figure 5
Reduced expression of Mup transcript(s) in WAT of ob/ob mice. A. qPCR assessment of transcript level in wild type (WT) and ob/ob (ob) SC WAT and RP WAT depots using the Mup1 primer set. B. qPCR assessment of transcript level in WT and ob SC WAT and RP WAT depots using the Mup1/2 primer set. For each graph, the signal in the respective WT tissue was set to a value of 100. For A and B the left panel shows data corrected against Gapdh and the right panel show data corrected against 36B4 as internal control for qPCR analysis; values stated in the text are the average of the Gapdh-corrected and 36B4-corrected data for each comparison. For A and B, * indicates p < 0.001 for WT SC vs. ob SC and for WT RP vs. ob RP. C. Northern blot analysis of 5 μg of total RNA from the indicated WAT depot or BAT from WT or ob/ob mice. Blot was hybridized to Mup1, aFABP or SCD1 32P dATP-labeled probes. Ethidium bromide staining of rRNA is shown as a gel loading control.
Figure 6
Figure 6
qPCR analysis of tissue distribution of Mup transcript(s) expression. qPCR analysis using the Mup1 primer set (A and B) or the Mup 1/2 primer set (C and D). For A and C the SC WAT level was set to a value of 1. For B and D the transcript level in spleen was set to a value of 1. For A – D, data was corrected against Gapdh (black fill) and or 36B4 (white fill) as internal control for qPCR analysis; values stated in the text are the average of the Gapdh-corrected and 36B4-corrected data for each comparison. For A and C, * indicates p < 0.001 for liver vs. SC WAT. For D, * indicates p < 0.05 for SC WAT vs. all others.
Figure 7
Figure 7
Northern blot analysis of Mup transcript expression in murine tissues. Northern blot analysis of a panel of C57Bl/6J murine tissues hybridized with a 32P dATP-labeled Mup1 probe. Lower panel shows Northern blot analysis of liver tissue from two wild type (WT) and two ob/ob mice. Ethidium bromide staining of rRNA is shown as a gel loading control.

References

    1. Ahima RS. Adipose tissue as an endocrine organ. Obesity (Silver Spring) 2006;14:242S–249S. doi: 10.1038/oby.2006.317. - DOI - PubMed
    1. Camp HS, Ren D, Leff T. Adipogenesis and fat-cell function in obesity and diabetes. Trends Mol Med. 2002;8:442–447. doi: 10.1016/S1471-4914(02)02396-1. - DOI - PubMed
    1. Coppack SW. Pro-inflammatory cytokines and adipose tissue. Proc Nutr Soc. 2001;60:349–356. - PubMed
    1. Gregoire FM. Adipocyte differentiation: from fibroblast to endocrine cell. Exp Biol Med (Maywood) 2001;226:997–1002. - PubMed
    1. Shimomura I, Funahashi T, Takahashi M, Maeda K, Kotani K, Nakamura T, Yamashita S, Miura M, Fukuda Y, Takemura K, Tokunaga K, Matsuzawa Y. Enhanced expression of PAI-1 in visceral fat: possible contributor to vascular disease in obesity. Nat Med. 1996;2:800–803. doi: 10.1038/nm0796-800. - DOI - PubMed

Publication types

MeSH terms