. 2008 Nov;39(11):3057-63.
doi: 10.1161/STROKEAHA.108.520114. Epub 2008 Aug 21.

Rapidly increased neuronal mitochondrial biogenesis after hypoxic-ischemic brain injury

Affiliations

Rapidly increased neuronal mitochondrial biogenesis after hypoxic-ischemic brain injury

Wei Yin et al. Stroke. 2008 Nov.

Abstract

Background and purpose: Mitochondrial biogenesis is regulated through the coordinated actions of both nuclear and mitochondrial genomes to ensure that the organelles are replenished on a regular basis. This highly regulated process has been well defined in skeletal and heart muscle, but its role in neuronal cells, particularly when under stress or injury, is not well understood. In this study, we report for the first time rapidly increased mitochondrial biogenesis in a rat model of neonatal hypoxic/ischemic brain injury (H-I).

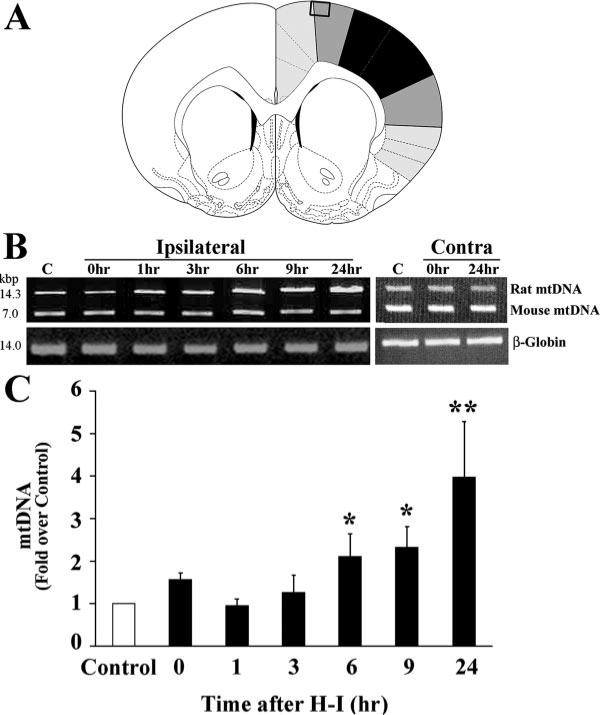
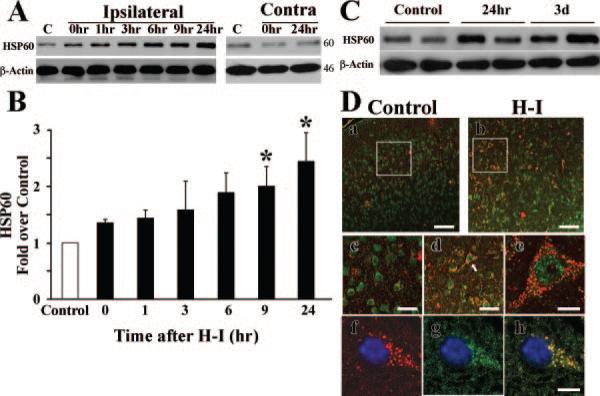
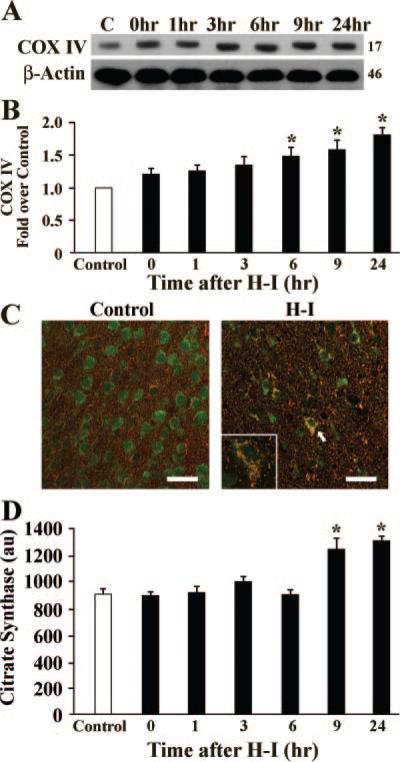
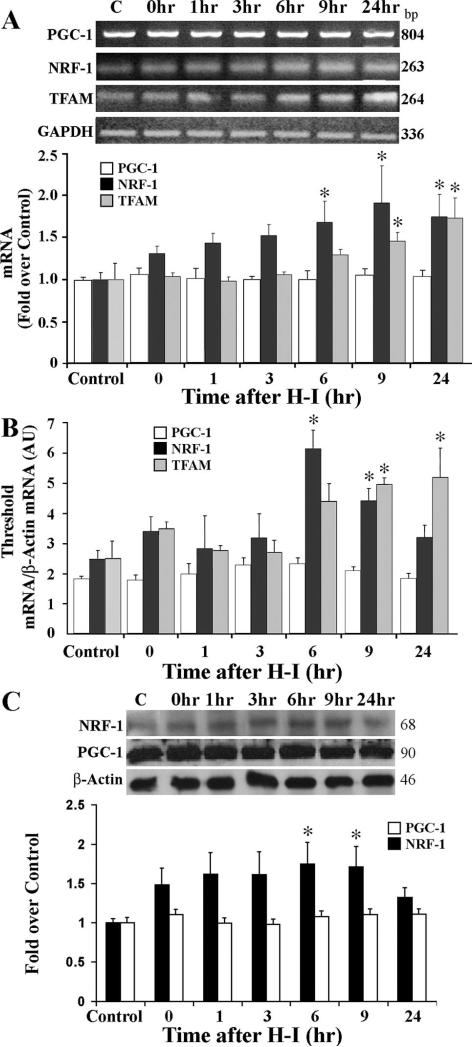
Methods: Postnatal day 7 rats were subjected to H-I induced by unilateral carotid artery ligation followed by 2.5 hours of hypoxia. The relative amount of brain mitochondrial DNA (mtDNA) was measured semiquantitatively using long fragment PCR at various time points after H-I. HSP60 and COXIV proteins were detected by Western blot. Expression of three genes critical for the transcriptional regulation of mitochondrial biogenesis, peroxisome proliferator-activated receptor coactivator-1 (PGC-1), nuclear respiratory factor-1 (NRF-1), and mitochondrial transcription factor A (TFAM), were examined by Western blot and RT-PCR.

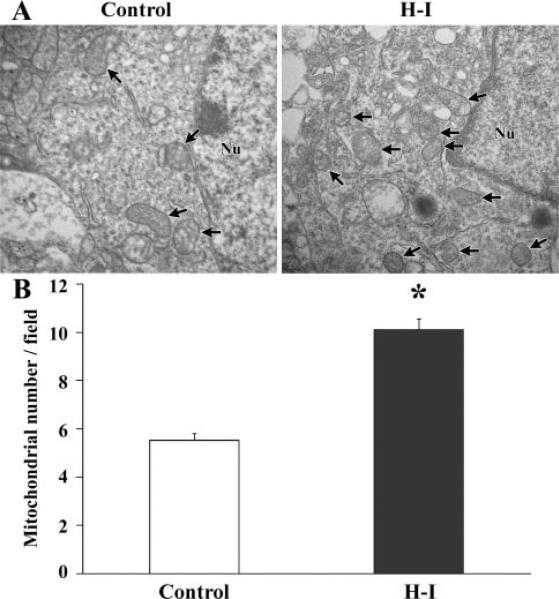
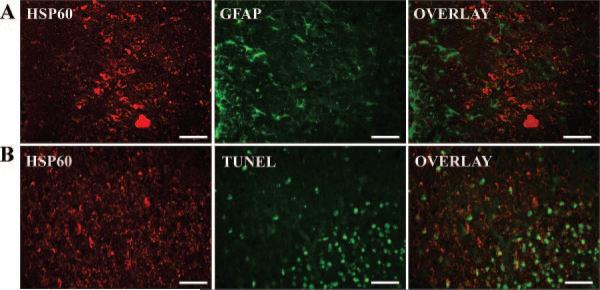
Results: Brain mtDNA content was markedly increased 6 hours after H-I, and continued to increase up to 24 hours after H-I. Paralleling the temporal change in mtDNA content, mitochondrial number and proteins HSP60 and COXIV, and citrate synthase activity were increased in neurons in the cortical infarct border zone after H-I. Moreover, cortical expression of NRF-1 and TFAM were increased 6 to 24 hours after H-I, whereas PGC-1 was not changed.

Conclusions: Neonatal H-I brain injury rapidly induces mitochondrial biogenesis, which may constitute a novel component of the endogenous repair mechanisms of the brain.


Figures

Figure 1
Figure 1
Mitochondrial DNA content after H-I. A, The shaded area in this coronal section of rat brain shows the region where cortical samples were taken for biochemical and molecular analysis (adapted from Paxinos and Watson30). Cortical samples from black area was excluded, whereas the boxed region represents the area used for morphological studies. B, The relative amounts of cortical mtDNA at various times after H-I was measured semiquantitatively using long fragment PCR. Mouse genomic DNA was also amplified in the same tube as an internal control. Ipsilateral indicates cortical samples from the ipsilateral side to the ligation; Contra, cortical samples from the contralateral side to the ligation. C, The fold change of rat mtDNA over control was significantly increased beginning 6 hours after H-I injury. Amplification of mouse genomic DNA or β-globin did not significantly vary between samples. For each time point, n=6 pups. *P<0.05, **P<0.01 compared with control.
Figure 2
Figure 2
The number of mitochondria in the cortex 24 hours after H-I. A, Transmission electron microscope image of a section from control brain showing normal ultrastructural features in cortical cells. The nucleus (Nu) is surrounded by relatively uniform and compact mitochondria. In the H-I–exposed ipsilateral cortex, an enhanced number of mitochondria were observed. B, Quantification of the number of cortical mitochondria per photomicrograph. The increase in mitochondrial density was approximately 76% 24 hours after H-I. Magnification of brain sections, 5000×. Nu indicates nucleus; arrows, mitochondria. For each group, n=3 pups and 30 photomicrographs were counted per animal. *P<0.05 compared with control.
Figure 3
Figure 3
Expression of HSP60 protein after H-I. A, Representative Western blots showing HSP60 protein levels at different times after H-I. Beta-actin was used as the loading control, and the approximate molecular weights for each band are shown at the right. Ipsilateral indicates cortical samples from the ipsilateral side to the ligation; Contra, cortical samples from the contralateral side to the ligation. B, Graph showing semiquantitative analysis of the protein levels in A. Six animals were included in each group. *P<0.05 compared with control group. C, Representative Western blots demonstrating that the increase in HSP60 protein was sustained for 3 days after H-I. D, Confocal images of NeuN (green) and HSP60 (red) immunostaining observed 24 hours after H-I (a and b, low power; c and d, high power). High-power image of HSP60 and NeuN (e) identified by the arrow shows that increased HSP60 is expressed in a large, pyramidal-shaped neuron. h, Merged image of HSP60 (red, f) and VDAC (green, g), showing the colocalization of HSP60 with VDAC. Scale bars: a and b=50 μm, c and d=25 μm, e and h=10 μm.
Figure 4
Figure 4
Localization of HSP60, GFAP, and TUNEL staining. Immunoreactivity in the cortex 24 hours after H-I is shown for HSP60 (red) and GFAP (green, top row, A) or TUNEL staining (green, bottom row, B). The merged images (rightmost column) show that HSP60 did not colocalize with either GFAP or TUNEL staining. Scale bars=50 μm.
Figure 5
Figure 5
Expression of COXIV and citrate synthase activity in the cortex. A, Representative Western blots stained for COXIV protein at the times indicated after H-I. C is control lane; β-actin was used as a loading control, and the approximate molecular weights for each band are shown at the right. B, Histogram showing semiquantitative analysis of the COXIV protein levels in (A) relative to control. For each time point, n=6 pups. *P<0.05 compared to the control group. C, Confocal fluorescent images of the cortex from Control or H-I brains at 24 hours showing COXIV immunoreactivity in red and NeuN in green. High expression of COXIV is seen in neurons. Insert shows high-power (60×) magnification of a neuron identified by the arrow. D, Citrate synthase activity (arbitrary units, au) at the times indicated after H-I. *P<0.05 compared to the control group. Scale bar=125 μm.
Figure 6
Figure 6
mRNA and protein expression of mitochondrial biogenesis factors in the cortex. A, Representative agarose gel of RT-PCR products of PGC-1, NRF-1, and TFAM mRNA prepared from control (C) or at the indicated times after H-I. The histogram below shows semiquantitative measurement of PCR products from (A) obtained by densitometric analysis relative to the control level. B, Analysis of quantitative real-time RT-PCR from control or H-I brains at the indicated times for PGC-1, NRF-1, and TFAM normalized to β-actin. C, Representative Western blots for PGC-1 and NRF-1 in cortex from control and various time points after H-I. For each group in all experiments, n=6 pups. *P<0.05 compared with the respective control.

References

    1. Achanta G, Sasaki R, Feng L, Carew JS, Lu W, Pelicano H, Keating MJ, Huang P. Novel role of p53 in maintaining mitochondrial genetic stability through interaction with DNA pol gamma. EMBO J. 2005;24:3482–3492. - PMC - PubMed
    1. Fiskum G. Mitochondrial participation in ischemic and traumatic neural cell death. J Neurotraum. 2000;17:843–855. - PubMed
    1. St-Pierre J, Drori S, Uldry M, Silvaggi JM, Rhee J, Jager S, Handschin C, Zheng K, Lin J, Yang W, Simon DK, Bachoo R, Spiegelman BM. Suppression of reactive oxygen species and neurodegeneration by the pgc-1 transcriptional coactivators. Cell. 2006;127:397–408. - PubMed
    1. Scarpulla RC. Nuclear control of respiratory gene expression in mammalian cells. J of Cell Biochem. 2006;97:673–683. - PubMed
    1. Blomgren K, Hagberg H. Free radicals, mitochondria, and hypoxia-ischemia in the developing brain. Free Radic Biol Med. 2006;40:388–397. - PubMed

Publication types

MeSH terms