. 2008 Oct 31;283(44):29740-52.
doi: 10.1074/jbc.M802856200. Epub 2008 Aug 21.

A conserved Cys-loop receptor aspartate residue in the M3-M4 cytoplasmic loop is required for GABAA receptor assembly

Affiliations

A conserved Cys-loop receptor aspartate residue in the M3-M4 cytoplasmic loop is required for GABAA receptor assembly

Wen-yi Lo et al. J Biol Chem. .

Abstract

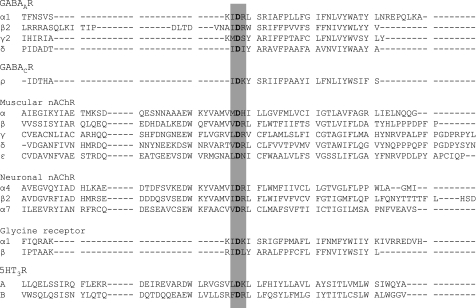
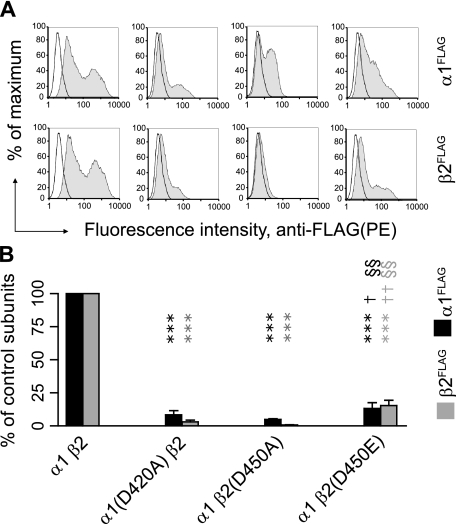
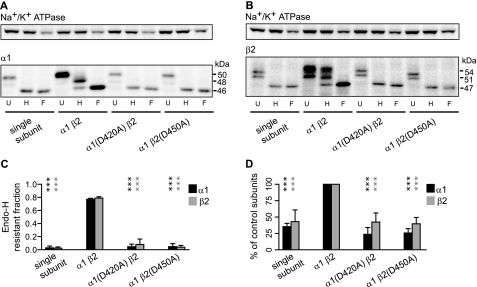
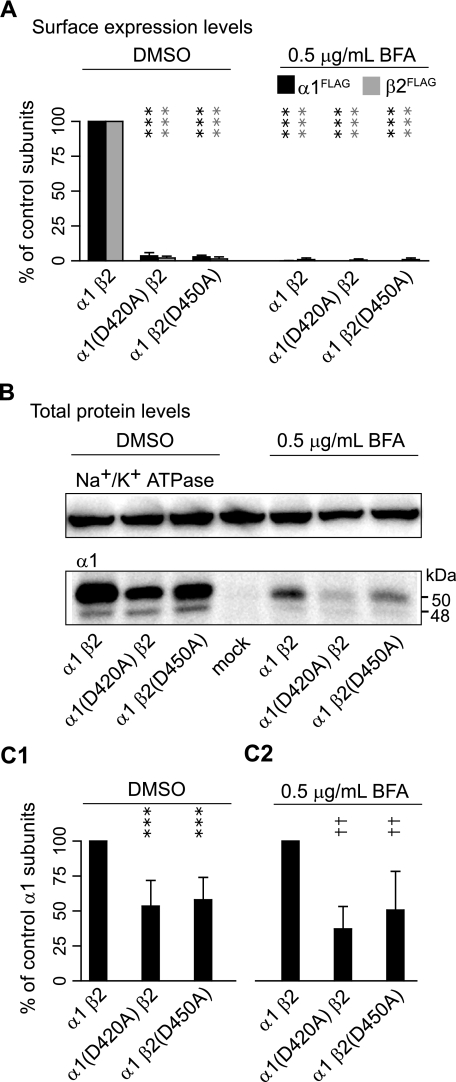
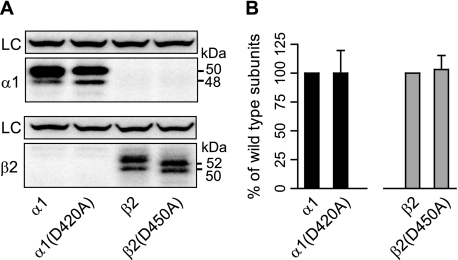
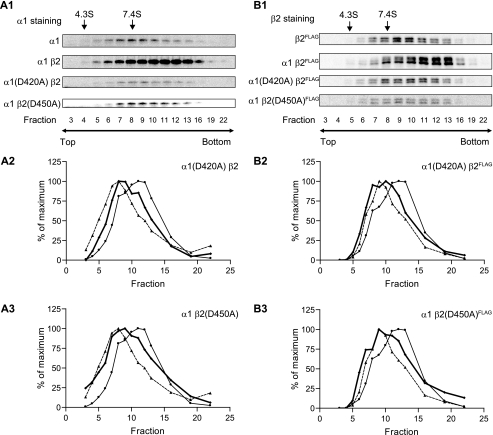
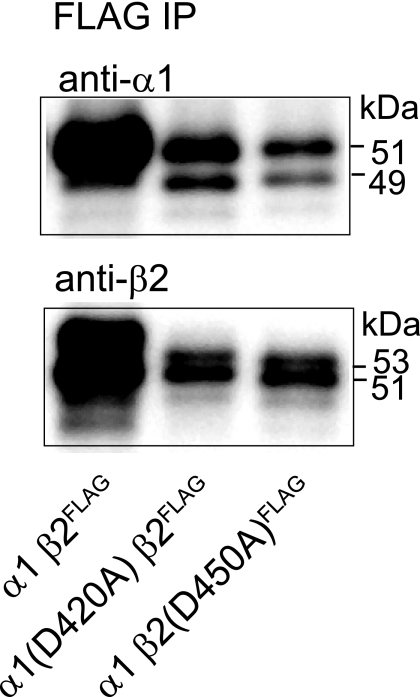
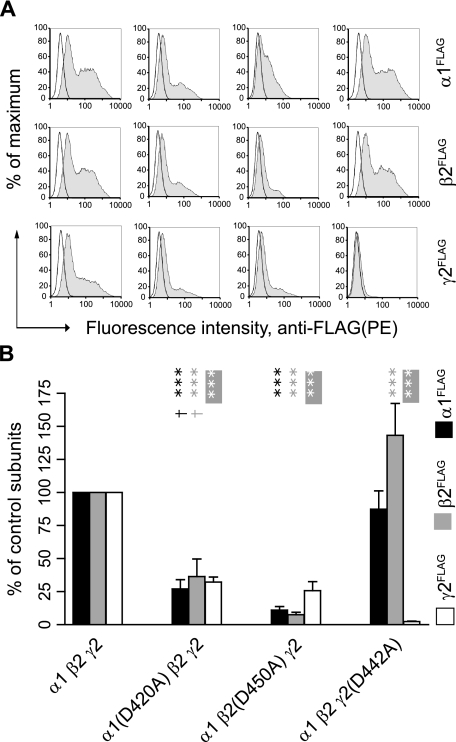
Members of the Cys-loop superfamily of ligand-gated ion channels, which mediate fast synaptic transmission in the nervous system, are assembled as heteropentamers from a large repertoire of neuronal subunits. Although several motifs in subunit N-terminal domains are known to be important for subunit assembly, increasing evidence points toward a role for C-terminal domains. Using a combination of flow cytometry, patch clamp recording, endoglycosidase H digestion, brefeldin A treatment, and analytic centrifugation, we identified a highly conserved aspartate residue at the boundary of the M3-M4 loop and the M4 domain that was required for binary and ternary gamma-aminobutyric acid type A receptor surface expression. Mutation of this residue caused mutant and partnering subunits to be retained in the endoplasmic reticulum, reflecting impaired forward trafficking. Interestingly although mutant and partnering wild type subunits could be coimmunoprecipitated, analytic centrifugation studies demonstrated decreased formation of pentameric receptors, suggesting that this residue played an important role in later steps of subunit oligomerization. We thus conclude that C-terminal motifs are also important determinants of Cys-loop receptor assembly.


Figures

FIGURE 1.
FIGURE 1.
Theβ2 subunit M3-M4 loop contains multiple protein binding motifs. C-terminal and N-terminal portions of β2 subunit M3 and M4 transmembrane domains, respectively, are highlighted in gray. The numbers above the sequences indicate the start and finish of the M3-M4 loop and its known protein binding motifs (underlined). The names of directly associated proteins are indicated beneath the sequence. The numbering is relative to the first amino acid of the immature polypeptide.
FIGURE 2.
FIGURE 2.
Deletion of the β2 subunit M3-M4 loop, β2K339-R451Δ, substantially reduced α1β2 receptor surface expression. A1, representative distributions of R-phycoerythrin (PE) fluorescence intensities for cells coexpressing α1FLAGβ2(left panel) or α1FLAGβ2(loopΔ)(right panel) subunits and stained with a R-phycoerythrin-conjugated monoclonal anti-FLAG antibody (M2 clone) were plotted as frequency histograms. The x axis indicates the fluorescence intensity in arbitrary units (note the log scale), and the y axis indicates the percentage of the maximum cell count. Representative distributions obtained from mock-transfected cells (unfilled histograms) are overlaid with each experimental distribution (filled histograms). A2, surface α1FLAG subunit levels were quantified using the fluorescence index (see “Experimental Procedures”) and plotted as a percentage of control α1FLAGβ2 subunit coexpression. B1 and B2, as in A1 and A2 except for cells coexpressing α1β2FLAG (left panel) or α1β2(loopΔ)FLAG (right panel) subunits. Values reported are mean ± S.D. *** corresponds to p < 0.001 compared with the control subunit coexpression.
FIGURE 3.
FIGURE 3.
Replacement of β2 subunit M3-M4 loops by α1 subunit M3-M4 loops partially rescued surface expression of α1β2 receptors. A, representative fluorescence histograms of cells with control α1β2(first column), α1β2(loopΔ) (second column), α1β2β2(loopΔ) (third column), or α1β2α1 (fourth column) subunit coexpression were generated. Upper panels indicate surface α1FLAG subunit levels; lower panels indicate surface β2FLAG subunit levels. B, surface α1FLAG (black bars) and β2FLAG (gray bars) subunit levels were quantified in each condition as a percentage of control subunit coexpression. Values reported are mean ± S.D. C, representative currents were obtained using rapid drug application from cells with control α1β2, α1β2(loopΔ), α1β2β2(loopΔ), and α1β2α1 subunit coexpression in response to a 2-s pulse of 1 mm GABA. The duration of GABA application is indicated by a white bar above the current traces. The inset shows mean peak current amplitudes of each condition. Values reported are mean ± S.E. *** indicates p < 0.001 relative to control α1β2 subunit coexpression. †† and ††† indicate p < 0.01 and p < 0.001, respectively, relative to α1β2(loopΔ) subunit coexpression. PE, R-phycoerythrin.
FIGURE 4.
FIGURE 4.
Segmental deletions of the β2 subunit M3-M4 loop decreased α1β2 receptor surface levels. A, schematics of the β2 subunit M3-M4 loop segmental deletion constructs are shown. β2(loopΔ), β2(BIG2Δ), β2(GRIF-1Δ), β2(postGRIF-1Δ), β2(postGRIF-1+), β2(postAP2Δ), and β2(postAP2+) represent β2K339–R451Δ, β2N327–K344Δ, β2A348–L418Δ, β2R420–R451Δ, β2N327–E419Δ, β2I438–R451Δ, and β2N327–K437Δ, respectively. Retained regions of the M3-M4 loop are shown in black; deleted regions are bordered by dotted lines. B, relative surface expression levels of α1FLAG (black bars) and β2FLAG (gray bars) subunits when each of the β2 subunit deletion constructs was coexpressed with a wild type α1 subunit. Values reported are mean ± S.D. *, **, and *** indicate p < 0.05, p < 0.01, and p < 0.001, respectively, relative to control α1β2 subunit coexpression. ††† indicates p < 0.001 relative to α1β2(loopΔ) subunit coexpression.
FIGURE 5.
FIGURE 5.
Alignment of human Cys-loop receptor subunits revealed a conserved aspartate residue at the junction of the M3-M4 loop and the M4 domain. Partial sequences surrounding the junction of the M3-M4 cytoplasmic loop and the M4 transmembrane domain are shown for a subset of Cys-loop receptor subunits. The dashes represent gaps in the alignment. The IDR and comparable motifs are highlighted in gray, and the conserved aspartate residues are bold. Note that all 45 known human Cys-loop receptor subunits contain this residue. GABACR, GABAC receptor; GABAAR, GABAA receptor; 5HT3R, 5-hydroxytryptamine type 3 receptor.
FIGURE 6.
FIGURE 6.
Mutation of the conserved M3-M4 aspartate residue in either α1 or β2 subunits markedly reduced α1β2 receptor surface levels. A, representative fluorescence histograms of cells with control α1β2(first column), α1(D420A)β2(second column), α1β2(D450A) (third column), or α1β2(D450E) (fourth column) subunit coexpression were generated. Upper panels indicate surface α1FLAG subunit levels; lower panels indicate surface β2FLAG subunit levels. B, surface α1FLAG (black bars) and β2FLAG (gray bars) subunit levels were quantified in each condition as a percentage of control subunit coexpression. Values reported are mean ± S.D. *** indicates p < 0.001 relative to control α1β2 subunit coexpression. † and †† indicate p < 0.05 and p < 0.01, respectively, relative to α1(D420A)β2 subunit coexpression. §§ indicates p < 0.01 relative to α1β2(D450A) subunit coexpression. PE, R-phycoerythrin.
FIGURE 7.
FIGURE 7.
Mutation of the conserved aspartate residue resulted in reduced subunit total protein levels and ER retention of both mutant and partnering subunits. A, 10 mm Tris-RIPA buffer-extracted proteins from expression of the α1 subunit alone (“single subunit”) or coexpression of α1β2, α1(D420A)β2, and α1β2(D450A) subunits were undigested (U) or digested with endo H (H) or peptide N-glycosidase-F (F). An equal amount of total protein was loaded in each well. The undigested α1 subunits had mobility mainly at 50 kDa with a less apparent band that migrated at 48 kDa. After endo H digestion, α1 subunits with mobility equal to that of subunits digested with peptide N-glycosidase-F (46 kDa) were considered endo H-sensitive, whereas those with a higher molecular mass were considered endo H-resistant. B, the criteria used in A were used to distinguish endo H-sensitive and -resistant populations of β2 subunits. Therefore, subunits that migrated at 54 and 51 kDa were considered to be endo H-resistant, whereas those that migrated at 47 kDa were considered to be endo H-sensitive. C, the fractions of endo H-resistant populations of total α1(black bars) or β2(gray bars) subunits in the four expression conditions were quantified by dividing the IDVs of the endo H-resistant bands by the summed IDVs of the endo H-resistant and -sensitive bands. D, total subunit levels in each of the four expression conditions were compared. IDVs of α1 or β2 subunits were normalized to those obtained with control subunit coexpression. Values reported are mean ± S.D. *** indicates p < 0.001 relative to control subunit coexpression.
FIGURE 8.
FIGURE 8.
Control subunit total protein levels remained higher than those with α1(D420A)β2 or α1β2(D450A) subunit coexpression when retained in the ER. A, surface α1FLAG (black bars) and β2FLAG (gray bars) subunit levels were quantified in each condition as a percentage of control α1β2 subunit coexpression after applying either DMSO (left) or 0.5 μg/ml brefeldin A(BFA; right) 6 h after transfection. B, immunoblots measuring Na+/K+-ATPase (upper panel; loading control) and α1 subunit (lower panel) total protein levels with α1β2, α1(D420A)β2, or α1β2(D450A) subunit coexpression after applying either DMSO (left) or 0.5 μg/ml brefeldin A (right) 6 h after transfection. C1, normalized total α1 protein levels with DMSO treatment. C2, normalized total α1 protein levels with brefeldin A treatment. Values reported are mean ± S.D. *** indicates p < 0.001 relative to control subunit coexpression with DMSO treatment. †† indicates p < 0.01 relative to control subunit coexpression with brefeldin A treatment.
FIGURE 9.
FIGURE 9.
Single subunit total protein levels were determined using Western blot analysis. A, total proteins were extracted from cells expressing single α1, α1(D420A), β2, or β2(D450A) subunits using high detergent RIPA buffer and immunoblotted with monoclonal anti-α1(upper panels) and anti-β2(lower panels) antibodies. Note that two nonspecific bands were detected with the anti-β2 antibodies (lower panels, first two lanes). Na+/K+-ATPase was used as loading control (LC). B, total protein levels with single subunit expression were quantified. Black bars represent α1 subunit levels; gray bars represent β2 subunit levels. To control for loading variability, the specific IDVs of α1 or β2 subunits were normalized to those of Na+/K+-ATPase. To compare wild type and mutant subunits, the adjusted IDVs of mutant subunits were further normalized to those of wild type subunits. Values reported are mean ± S.D.
FIGURE 10.
FIGURE 10.
GABAA receptor protein complexes were analyzed using sucrose density gradients. Whole cell lysates were extracted using high detergent RIPA buffer and subjected to 5–20% linear sucrose density gradients. Following centrifugation to separate protein complexes of different sizes, gradients were fractionated into 23 fractions from the top to bottom. 14 fractions were selected to analyze the sedimentation coefficients using Western blot and compared with proteins with known sedimentation coefficients (bovine serum albumin, 4.3 S; aldolase, 7.4 S). The chosen fractions are indicated beneath the Western blots. A1, representative Western blots of α1 subunit staining in single subunit (α1), α1β2, α1(D420A)β2, and α1β2(D450A) expression conditions are presented. A2, the distribution of protein complexes containing α1(D420A) subunits with α1(D420A)β2 subunit coexpression was plotted (bold line). The distributions of protein complexes containing α1 subunits with single subunit expression (dotted line with ▴) or α1β2 subunit coexpression (solid line with ▴) are included for comparison. A3, as in A2 except for protein complexes containing α1 subunits with α1β2(D450A) subunit coexpression. B1, B2, and B3, as in A1, A2, and A3, except that staining was for β2FLAG subunits using anti-β2 antibodies following immunoprecipitation with anti-FLAG M2 beads (to eliminate nonspecific staining; see Fig. 9).
FIGURE 11.
FIGURE 11.
FLAG-tagged and partnering GABAA receptor subunits were coimmunoprecipitated. Representative immunoblots of proteins immunoprecipitated (IP) from cells with α1β2FLAG, α1(D420A)β2FLAG, and α1β2(D450A)FLAG subunit coexpression using anti-FLAG M2 beads. Immunoprecipitated proteins were detected using monoclonal anti-α1(upper panel) or anti-β2 antibodies (lower panel). Note the 1-kDa shift in molecular mass due to insertion of the FLAG epitope in the β2 subunit (compared with immunoblots of untagged subunits shown in previous figures).
FIGURE 12.
FIGURE 12.
Mutation of the conserved aspartate residue to alanine in either α1, β2, or γ2S subunits markedly reduced α1β2γ2S receptor surface levels. A, representative fluorescence histograms of cells with control α1β2γ2S (first column), α1(D420A)β2γ2S (second column), α1β2(D450A)γ2S (third column), or α1β2γ2S(D442A) (fourth column) subunit coexpression were generated. Upper panels indicate surface α1FLAG subunit levels, middle panels indicate surface β2FLAG subunit levels, and lower panels indicate surface γ2S FLAG levels. B, surface α1FLAG (black bars), β2FLAG (gray bars), and γ2S FLAG (white bars) subunit levels were quantified in each condition as a percentage of control subunit coexpression. *** indicates p < 0.001 relative to control α1β2γ2S subunit coexpression. Values reported are mean ± S.D. † indicates p < 0.05 relative to α1β2(D450A)γ2S subunit coexpression.

Similar articles

Cited by

References

    1. Frugier, G., Coussen, F., Giraud, M. F., Odessa, M. F., Emerit, M. B., Boue-Grabot, E., and Garret, M. (2007) J. Biol. Chem. 282 3819–3828 - PubMed
    1. Gallagher, M. J., Song, L., Arain, F., and Macdonald, R. L. (2004) J. Neurosci. 24 5570–5578 - PMC - PubMed
    1. Harkin, L. A., Bowser, D. N., Dibbens, L. M., Singh, R., Phillips, F., Wallace, R. H., Richards, M. C., Williams, D. A., Mulley, J. C., Berkovic, S. F., Scheffer, I. E., and Petrou, S. (2002) Am. J. Hum. Genet. 70 530–536 - PMC - PubMed
    1. Kang, J. Q., and Macdonald, R. L. (2004) J. Neurosci. 24 8672–8677 - PMC - PubMed
    1. Shen, X. M., Ohno, K., Sine, S. M., and Engel, A. G. (2005) Brain 128 345–355 - PubMed

Publication types

LinkOut - more resources