. 2008 Sep 18;455(7211):401-5.
doi: 10.1038/nature07213. Epub 2008 Aug 24.

Regulatory networks define phenotypic classes of human stem cell lines

Affiliations

Regulatory networks define phenotypic classes of human stem cell lines

Franz-Josef Müller et al. Nature. .

Abstract

Stem cells are defined as self-renewing cell populations that can differentiate into multiple distinct cell types. However, hundreds of different human cell lines from embryonic, fetal and adult sources have been called stem cells, even though they range from pluripotent cells-typified by embryonic stem cells, which are capable of virtually unlimited proliferation and differentiation-to adult stem cell lines, which can generate a far more limited repertoire of differentiated cell types. The rapid increase in reports of new sources of stem cells and their anticipated value to regenerative medicine has highlighted the need for a general, reproducible method for classification of these cells. We report here the creation and analysis of a database of global gene expression profiles (which we call the 'stem cell matrix') that enables the classification of cultured human stem cells in the context of a wide variety of pluripotent, multipotent and differentiated cell types. Using an unsupervised clustering method to categorize a collection of approximately 150 cell samples, we discovered that pluripotent stem cell lines group together, whereas other cell types, including brain-derived neural stem cell lines, are very diverse. Using further bioinformatic analysis we uncovered a protein-protein network (PluriNet) that is shared by the pluripotent cells (embryonic stem cells, embryonal carcinomas and induced pluripotent cells). Analysis of published data showed that the PluriNet seems to be a common characteristic of pluripotent cells, including mouse embryonic stem and induced pluripotent cells and human oocytes. Our results offer a new strategy for classifying stem cells and support the idea that pluripotency and self-renewal are under tight control by specific molecular networks.


Figures

Figure 1
Figure 1. Sample collection and analysis for the Stem Cell Matrix
Cell preparations for the Stem Cell Matrix are cultured in the authors’ laboratory or collected from other sources worldwide. Samples are assigned source codes that capture their biological origin and an relatively unbiased description of the cell type (such as BNLin for brain-derived neural lineage). Samples are collected and processed at a central lab for microarray analysis on a single Illumina BeadStation instrument. The genomics data are processed by unsupervised algorithms that are capable of grouping the samples based on non-obvious expression patterns encoded in transcriptional phenotypes. For pathway discovery, existing high-content databases with experimental data (e.g. protein-protein-interaction data or gene sets) are combined with our transcriptional database, a priori assumed identity of cell types and bootstrapped sparse non-negative matrix factorization (sample clustering) to produce metadata that can be mined with Gene Set Analysis software and topology-based gene set discovery methods (systems wide network analysis). Web-based, computer-aided visualization methodologies can be used by researchers to formulate testable hypotheses and generate results and insights in stem cell biology. Two exemplary results we report in this paper are the classification of novel stem cell types in the context of other better understood stem cell preparations, and a molecular map of interacting proteins which appear to function in concert in pluripotent stem cells.
Figure 2
Figure 2. Clusters of samples based on machine learning algorithm
Samples were distributed on the basis of their transcriptional profiles into consensus clusters using sNMF. A. Consensus matrix from consensus clustering results (center matrix plot). The consensus matrix is a visual representation of the clustering results and the separation of the sample clusters from each other. Blue indicates no consensus, and red very high consensus. The numbers (1-12) on the diagonal row of clusters indicate the number assigned to the cluster by sNMF. These numbers (“Cluster 1” …“Cluster 12”) are used throughout the text to indicate the group of samples in that cluster. The bar graph above the consensus matrix plot shows the summary statistics assessing the overall quality of each cluster. The cluster consensus value (0-1) is plotted above the corresponding cluster in the matrix plot. Note that most clusters (Clusters 10, 12, 6, 4, 9, 1, 8, 11, 7, 2) have a high quality measurement. To the left of the consensus matrix is another view of the consensus data, visualized as a dendrogram. This is a representation of the hierarchical clustering tree of the consensus matrix B. The content of the sample clusters resulting from the same sNMF run are displayed. Numbers are the same cluster numbers assigned by the consensus clustering algorithm that are used throughout the text and figures. For more information on samples and Source Code and references see Supplementary Tables 1 – 10. # Number of samples, ¶ Samples were derived from adult brain specimens
Figure 3
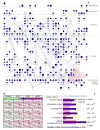
Figure 3. Pluripotent Stem Cell-specific protein-protein interaction network detected by MATISSE
Clusters from the sNMF k=12 analysis were used in combination with the transcriptional database to identify protein-protein interaction networks enhanced in PSC. A. A large differentially expressed connected subnetwork (“PluriNet”) shows the dominance of cell cycle regulatory networks in PSC (see legend). All of the dark blue symbols are genes that are highly expressed in most PSCs compared to the other cell samples in the dataset. Front nodes as represented by Stem Cell Matrix expression data and back nodes as inferred by MATISSE are displayed with different colour shades. Highlighted in red are the interactions of a group of proteins associated with pluripotency in murine ePSC. Interestingly, this subnetwork shows a significant enrichment in genes that are targeted in the genome by the transcription factors NANOG (p=5.88 * 10-4), SOX2 (p=0.058) and E2F (p=1.29 * 10-16, all p-values are Bonferroni corrected). For an interactive visualization of PluriNet, see www.stemcellmatrix.org. B. Heat map-like visualization of PluriNet genes for samples from the test dataset: HUVEC (UC-EC, a-b, derived from three independent individuals), germ cell tumor derived pluripotent stem cells (tPSC-UN, d-f, lines GCT-C4, GCT-72, GCT-27X, derived from three independent individuals), induced pluripotent stem cells (iPSC-UN, g-i, BJ1-iPS12, MSC-iPS1, hFib2-iPS5 three independently derived lines from different somatic sources) and embryonic stem cells (ePSC-UN, j-l, lines Hues22, HSF6, ES2, derived from three independent blastocysts in three independent labs). Most PluriNet genes are markedly up-regulated in iPSC-UN and ePSC-UN. tPSC-UN do show a less consistent expression pattern. UC-EC show lower expression levels of most PluriNet genes. Please refer to Supplementary Figure 5 for a larger version of the same Net-Heatmaps C. Analysis of genes from PluriNet in the context of phenotypes, which have been reported to result from specific genetic manipulations (e.g. gene knock-out) in mice in the MGI 3.6 phenotype ontology database (http://www.informatics.jax.org/). We find significant overrepresentation of phenotypes “lethality (perinatal/embryonic)”, “tumorigenesis”, “cellular”, “embryogenesis”, “reproductive system” and “life span and aging” among the genes in PluriNet. Although these broad categories might be rather unspecific surrogate markers for PSC function in mammals, this analysis might point towards PluriNet’s role in vivo. For more details, see also Supplementary Figure 6 and Supplementary Table 12.

References

    1. Müller FJ, Snyder EY, Loring JF. Gene therapy: can neural stem cells deliver? Nat Rev Neurosci. 2006;7:75–84. - PubMed
    1. Murry CE, Keller G. Differentiation of embryonic stem cells to clinically relevant populations: lessons from embryonic development. Cell. 2008;132:661–80. - PubMed
    1. Adewumi O, et al. Characterization of human embryonic stem cell lines by the International Stem Cell Initiative. Nat Biotechnol. 2007;25:803–16. - PubMed
    1. Brunet JP, Tamayo P, Golub TR, Mesirov JP. Metagenes and molecular pattern discovery using matrix factorization. Proc Natl Acad Sci U S A. 2004;101:4164–9. - PMC - PubMed
    1. Gao Y, Church G. Improving molecular cancer class discovery through sparse non-negative matrix factorization. Bioinformatics. 2005;21:3970–5. - PubMed

Publication types

MeSH terms

Associated data