. 2008 Aug 22;134(4):657-67.
doi: 10.1016/j.cell.2008.06.049.

Senescence of activated stellate cells limits liver fibrosis

Affiliations

Senescence of activated stellate cells limits liver fibrosis

Valery Krizhanovsky et al. Cell. .

Abstract

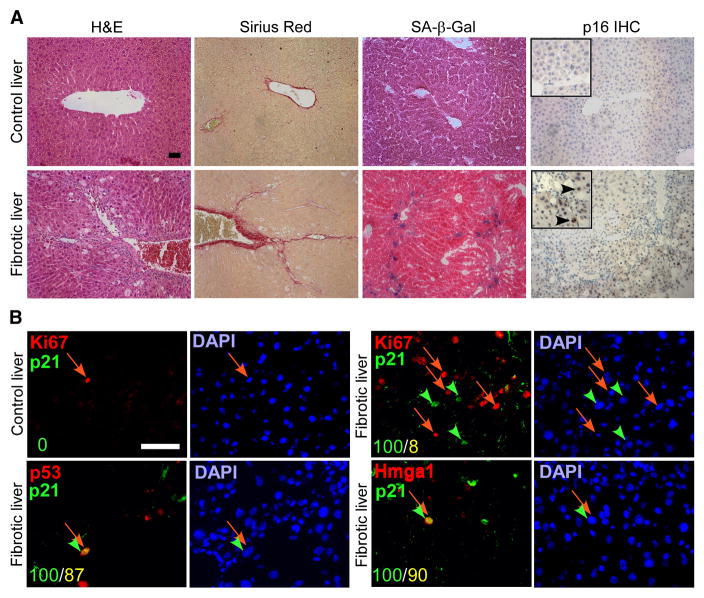
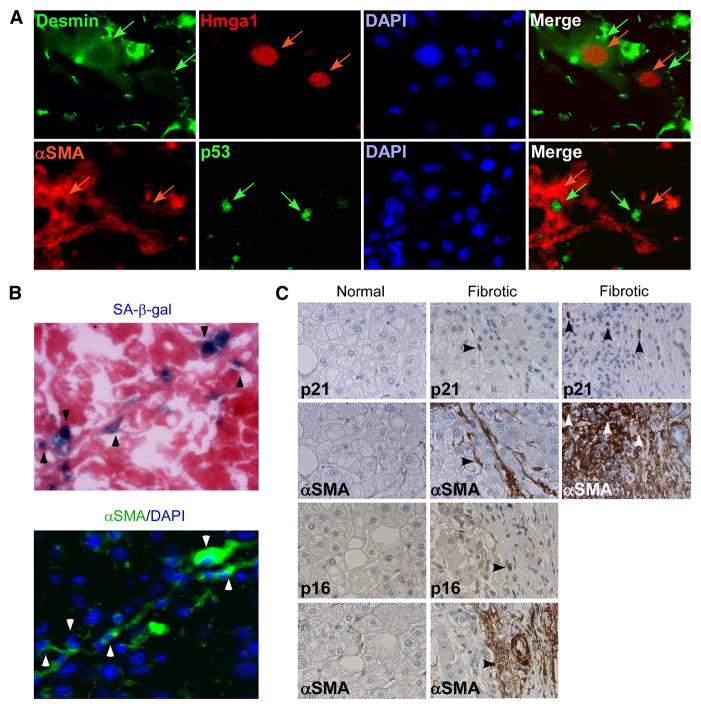
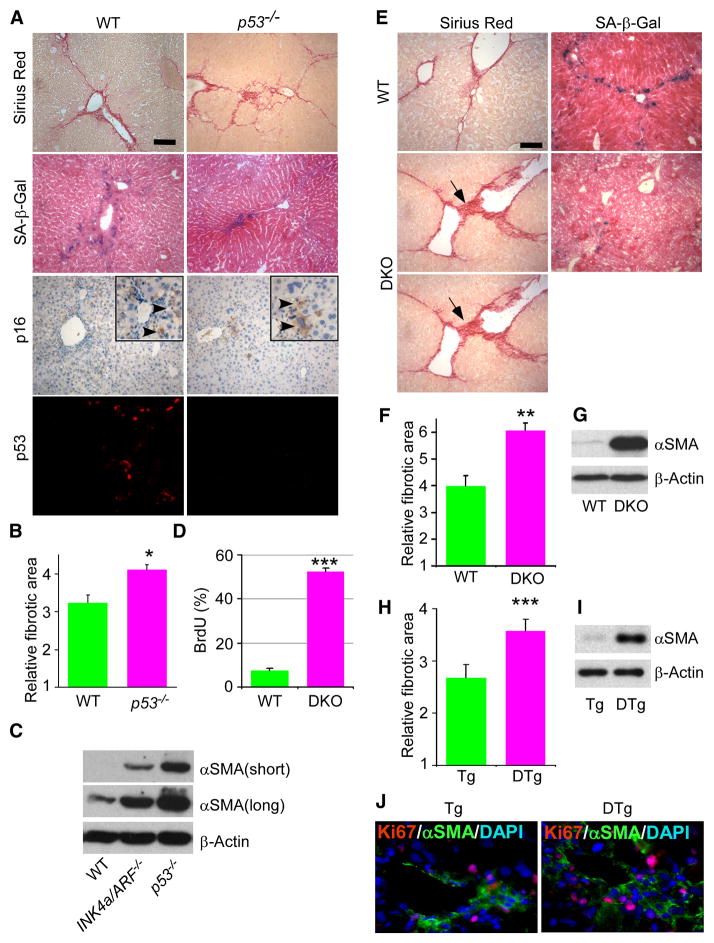
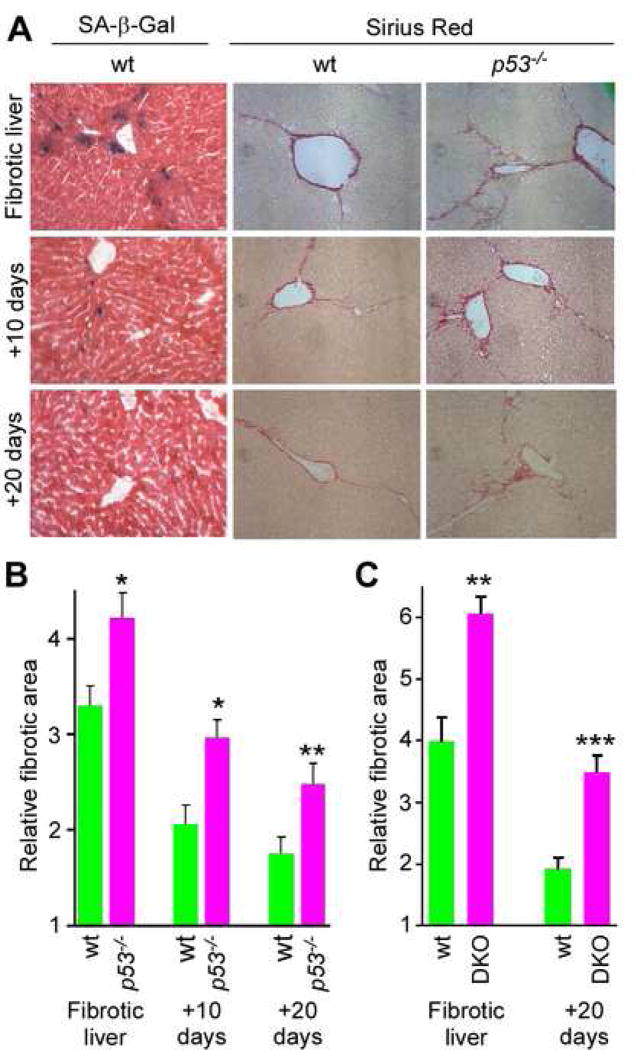
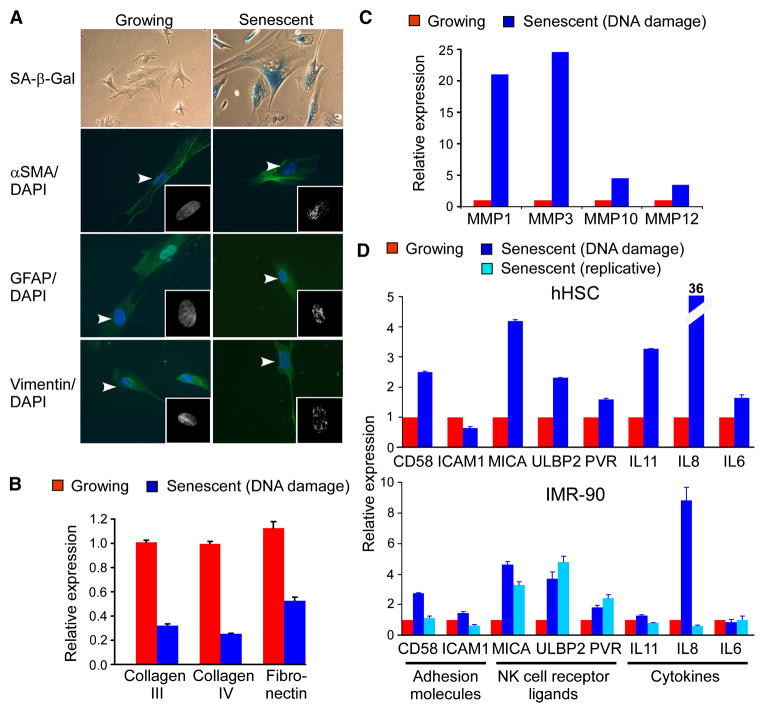
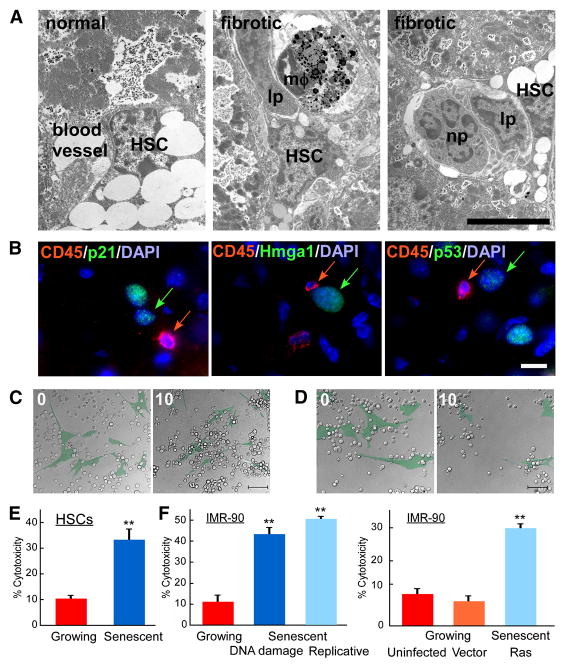
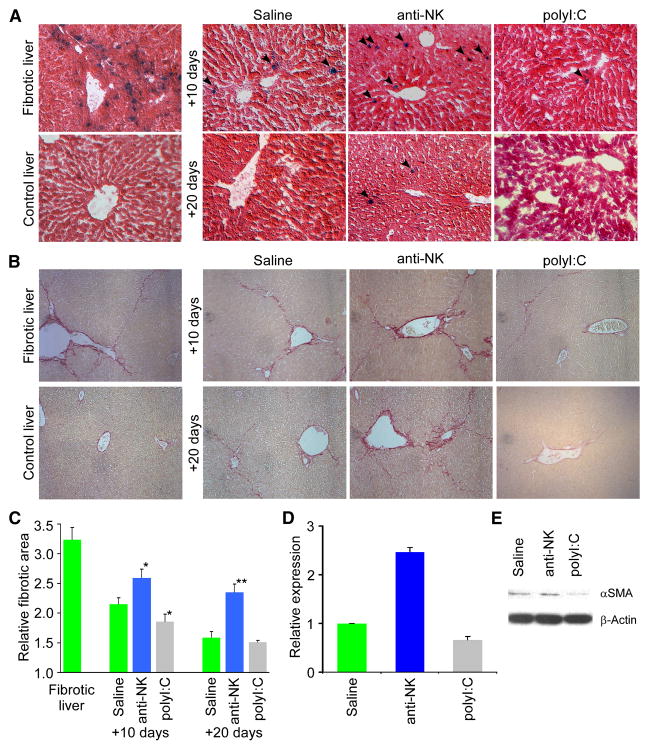
Cellular senescence acts as a potent mechanism of tumor suppression; however, its functional contribution to noncancer pathologies has not been examined. Here we show that senescent cells accumulate in murine livers treated to produce fibrosis, a precursor pathology to cirrhosis. The senescent cells are derived primarily from activated hepatic stellate cells, which initially proliferate in response to liver damage and produce the extracellular matrix deposited in the fibrotic scar. In mice lacking key senescence regulators, stellate cells continue to proliferate, leading to excessive liver fibrosis. Furthermore, senescent activated stellate cells exhibit gene expression profile consistent with cell-cycle exit, reduced secretion of extracellular matrix components, enhanced secretion of extracellular matrix-degrading enzymes, and enhanced immune surveillance. Accordingly natural killer cells preferentially kill senescent activated stellate cells in vitro and in vivo, thereby facilitating the resolution of fibrosis. Therefore, the senescence program limits the fibrogenic response to acute tissue damage.


Figures

Figure 1
Figure 1. Senescent cells are present in fibrotic livers
A. CCl4 (Fibrotic) but not vehicle (control) treated livers exhibit fibrotic scars (evaluated by H&E and Sirius Red staining). Multiple cells in the areas around the scar stain positively for senescence markers (SA-β-gal and p16 staining). B. The cells around the scar also co-express senescence markers p21, p53 and Hmga1, and are distinct from proliferating Ki67 positive cells. Numbers in the lower left corner indicate number of double positive cells (yellow) out of p21 positive cells (green). Scale bars are 50 μm.
Figure 2
Figure 2. Senescent cells are derived from activated HSCs
A. Senescent cells, identified by p53 and Hmga1 positive staining, express activated HSC markers Desmin and αSMA. Upper panel: Hmga1 positive nuclei (red arrows), and Desmin cytoplasmic staining (green arrows) in same cells. Lower panel: p53 positive nuclei (green arrows) and αSMA (red arrows) cytoplasmic staining in same cells. B. Senescent cells, identified by SA-β-gal stain positive for HSC marker αSMA on serial sections of mouse fibrotic liver. C. Senescent cells, identified by p21 or p16 stain positive for HSC marker αSMA on serial sections of human fibrotic liver. p21 and p16 positive cells are not present in normal liver sections.
Figure 3
Figure 3. Intact senescence pathways are required to restrict fibrosis progression
A. Mice lacking p53 develop pronounced fibrosis following CCl4 treatment, as identified by Sirius Red staining. Livers from wt or p53−/− mice treated with CCl4 were harvested and subjected to Sirius Red and SA-β-gal staining, and p16 immunocytochemistry and p53 immunofluorescence analysis. There are fewer senescent cells in mutant livers, as identified by SA-β-gal activity. B. Quantification of fibrosis based on Sirius Red staining. Values are means +SE. Fibrotic area in mutant animals was compared to wild type (wt) of corresponding time point using Student’s t-test (*-p<0.05, **-p<0.01). C. Immunoblot showing expression of αSMA in liver of mice treated with CCl4. There are more activated HSCs in the p53 and INK4a/ARF mutant mice than in wild type as shown by higher protein expression of the activated HSC marker αSMA analyzed by immunoblot. Two upper panels represent different exposures times for αSMA. D. BrdU incorporation over 2 hours in activated HSCs derived from wt and DKO mice. E. SA-β-gal activity and fibrosis (evaluated by Sirius Red) in livers from wt and p53−/−;INK4a/ARF−/− (DKO) mice treated with CCl4. Scale bars are 100 μm. F. Fibrosis was quantified as described before. There is stronger fibrosis in mice lacking both p53 and INK4a/ARF. G. Expression of αSMA in wild type and DKO fibrotic livers was evaluated by immunoblot. H. Fibrosis in TRE-shp53 (Tg) and GFAP-tTA;TRE-shp53 (DTg) was quantified as described before. I. Expression of αSMA in Tg and DTg fibrotic livers was evaluated by immunoblotting. J. There are more proliferating activated HSCs (Ki67 and αSMA positive) in DTg livers derived from mice treated with CCl4.
Figure 4
Figure 4. An intact senescence response promotes fibrosis resolution
Mice were treated with CCl4 for 6 weeks and livers were harvested 10 and 20 days following cessation of the treatment. A. There is a significant retention of fibrotic tissue in p53−/− livers comparing to wt ones as identified by Sirius Red staining at the 10 and 20 days time-points. SA-β-gal staining shows senescent cells at fibrotic liver, 10 and 20 days following cessation of fibrogenic treatment. Senescent cells are eliminated from the liver during reversion of fibrosis. Quantification of fibrosis in wt and p53−/− (B), or wt and p53−/−;INK4a/ARF−/− (DKO) (C), mice based on Sirius Red staining of livers. Values are means +SE; fibrotic area in mutant animals was compared to wt of corresponding time point using Student’s t-test (*-p<0.05, **-p<0.01, ***-p<0.001).
Figure 5
Figure 5. Senescent activated HSCs downregulate extracellular matrix production and upregulate genes that modulate immune surveillance
A. Activated HSCs treated with a DNA damaging agent, etoposide (Senescent), and intact proliferating cells (Growing) were stained for SA-β-gal activity and for expression of HSC markers (αSMA, GFAP, Vimentin) by immunofluorescent staining (green) and counterstained with DAPI (blue). Insets: Higher magnification of DAPI stained nuclear DNA shows presence of heterochromatic foci in senescent cells. Arrowheads point to nuclei shown in the insets. B. Quantitative RT-PCR analysis reveals decreased expression of extracellular matrix components in senescent activated HSCs. C. Extracellular matrix degrading matrix metalloproteinases are upregulated in senescent activated HSCs. Values represent the average of duplicate samples from microarrays. D. Quantitative RT-PCR analysis reveals increased expression of cytokines, adhesion molecules and NK cell receptor ligands in senescent activated HSCs and IMR-90 cells as compared to growing cells.
Figure 6
Figure 6. Immune cells recognize senescent cells
A. Immune cells are adjacent to activated HSCs in vivo as identified by electron microscopy of normal and fibrotic mouse livers. Immune cells (lp – lymphocytes, mφ-macrophage, np – neutrophil) localize adjacent to activated HSC. Scale bar is 5μm. B. Immune cells identified by CD45R (CD45) reside in close proximity to senescent cells (identified by p21, p53 and Hmga1) in mouse fibrotic liver. C, D. Senescent can be recognized by immune cells in vitro. Images from time lapse microscopy of the same field at start (0) and 10 hours after presenting interaction between NK cells (uncolored) and growing (C) or senescent (D) IMR-90 (pseudocolored, green) cells. Original images and time points are presented in Supplementary Figure 4. Scale bar is 100μm. E, F. Human NK cell line, YT, exhibits preferential cytotoxicity in vitro towards senescent activated HSCs (E) or senescent IMR-90 cells (F) compared to growing cells. In IMR-90 cells senescence was induced by DNA damage, extensive passaging in culture or by infection with oncogenic rasV12. Both uninfected and empty vector infected growing cells were used as controls. At least three independent experiments were performed in duplicates. Cytotoxicity based on crystal violet quantification at OD595 are shown, **-p<0.005 using Student’s t-test.
Figure 7
Figure 7. NK cells participate in fibrosis reversion and senescent cell clearance in vivo
A. Wild type mice treated with CCl4 were treated with either an anti-NK antibody (to deplete NK cells), polyI:C (as an interferon-γ activator) or saline (as a control) for 10 or 20 days prior to liver harvest. Liver sections stained for SA-β-gal show positive cells are retained in fibrotic livers following depletion of NK cells upon treatment with an anti-NK antibody in mice. In contrast, treatment with polyI:C results in enhanced clearance of senescent cells. B. Fibrotic tissue is retained upon depletion of NK cells as visualized by Sirius Red staining in contrast to saline or polyI:C treated mice, where it was depleted more efficiently. C. Quantification of fibrosis based on Sirius Red staining following 10 or 20 days of treatment with either saline, anti-NK antibody or PolyI:C. Values are means +SE. Fibrotic area in anti-NK or polyI:C treated animals was compared to saline treated animals of corresponding time point using Student’s t-test (*-p<0.05, **-p<0.01). D, E. Expression of αSMA in fibrotic livers after 10 days treatment with anti-NK antibody was increased comparing to saline treated ones, while it’s expression was decreased in polyI:C treated mice as evaluated by quantitative RT-PCR analysis (D) and immunoblot (E).

Comment in

References

    1. Bartkova J, Rezaei N, Liontos M, Karakaidos P, Kletsas D, Issaeva N, Vassiliou LV, Kolettas E, Niforou K, Zoumpourlis VC, et al. Oncogene-induced senescence is part of the tumorigenesis barrier imposed by DNA damage checkpoints. Nature. 2006;444:633–637. - PubMed
    1. Bataller R, Brenner DA. Liver fibrosis. J Clin Invest. 2005;115:209–218. - PMC - PubMed
    1. Berenguer M, Ferrell L, Watson J, Prieto M, Kim M, Rayon M, Cordoba J, Herola A, Ascher N, Mir J, et al. HCV-related fibrosis progression following liver transplantation: increase in recent years. J Hepatol. 2000;32:673–684. - PubMed
    1. Braig M, Lee S, Loddenkemper C, Rudolph C, Peters AH, Schlegelberger B, Stein H, Dorken B, Jenuwein T, Schmitt CA. Oncogene-induced senescence as an initial barrier in lymphoma development. Nature. 2005;436:660–665. - PubMed
    1. Campisi J, d’Adda di Fagagna F. Cellular senescence: when bad things happen to good cells. Nat Rev Mol Cell Biol. 2007;8:729–740. - PubMed

Publication types

Substances

Associated data