. 2008 Oct 21:1236:145-58.
doi: 10.1016/j.brainres.2008.07.122. Epub 2008 Aug 12.

Event-related fast optical signal in a rapid object recognition task: improving detection by the independent component analysis

Affiliations

Event-related fast optical signal in a rapid object recognition task: improving detection by the independent component analysis

Andrei V Medvedev et al. Brain Res. .

Abstract

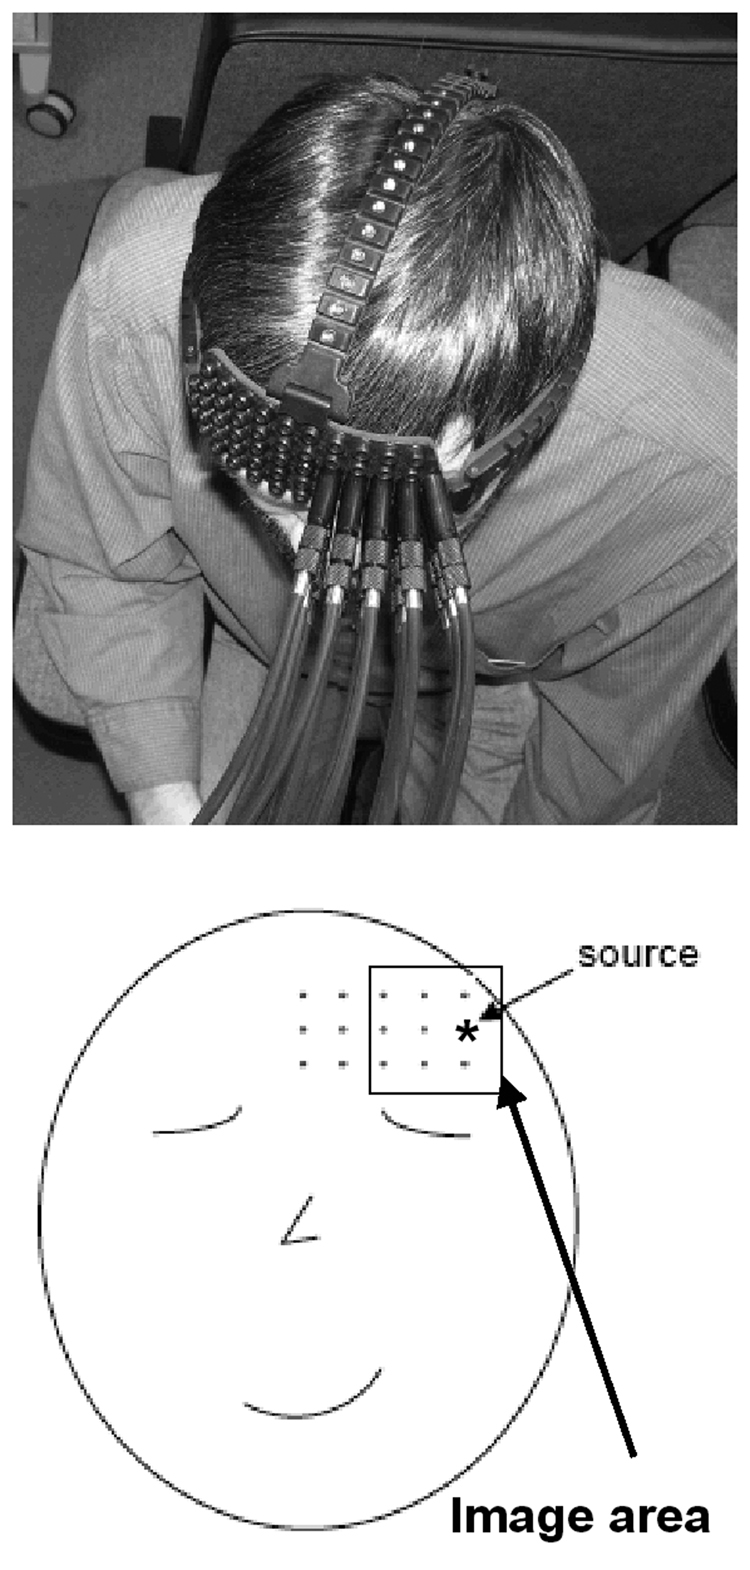
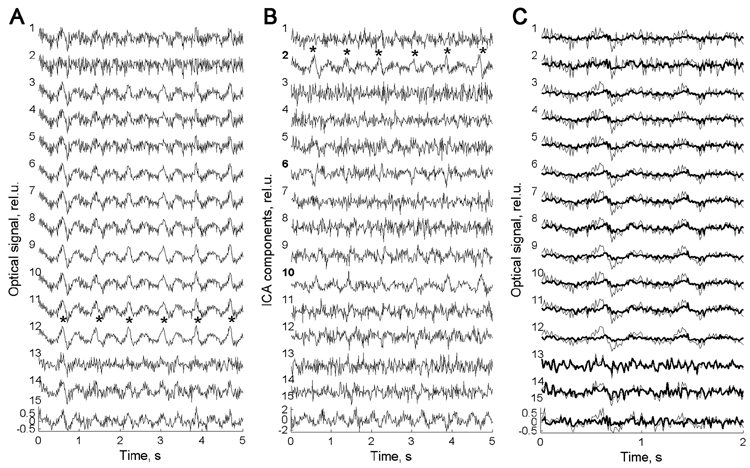
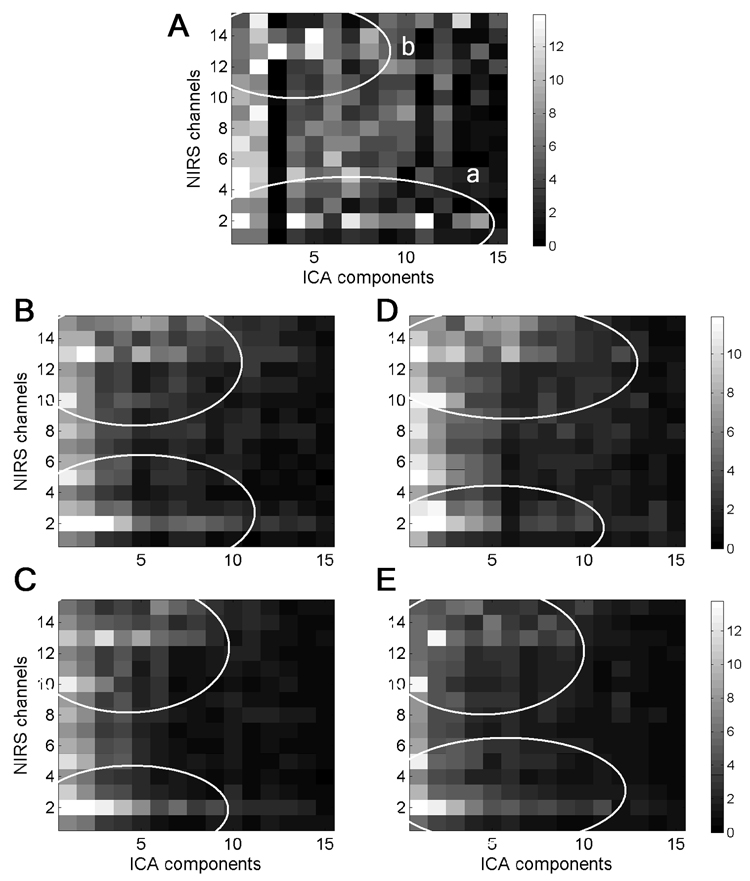
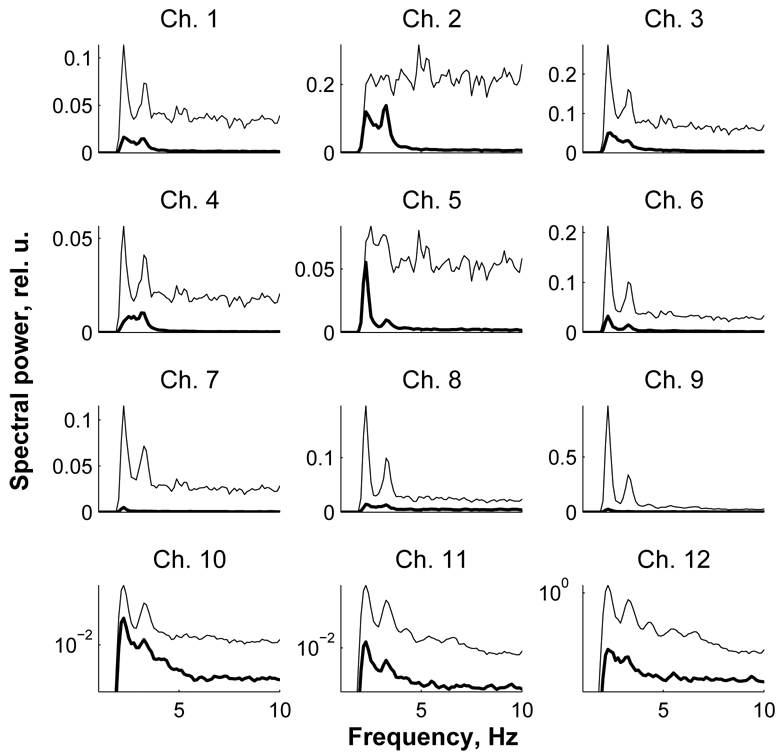
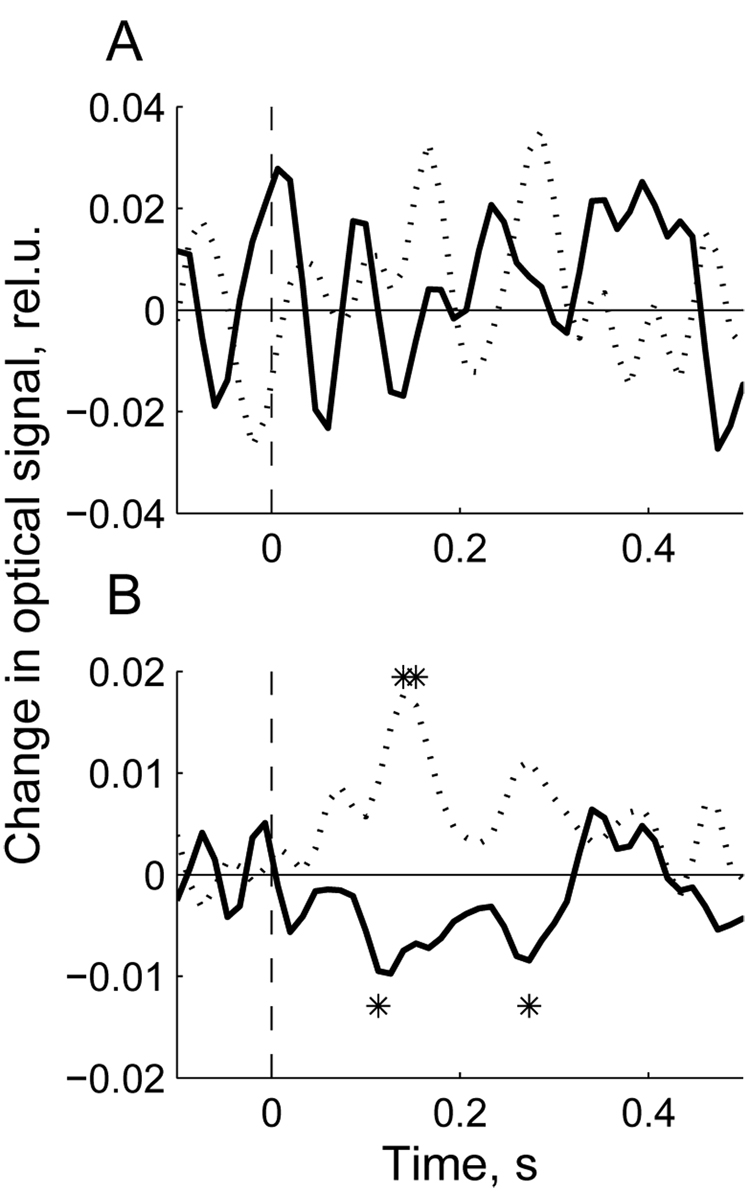
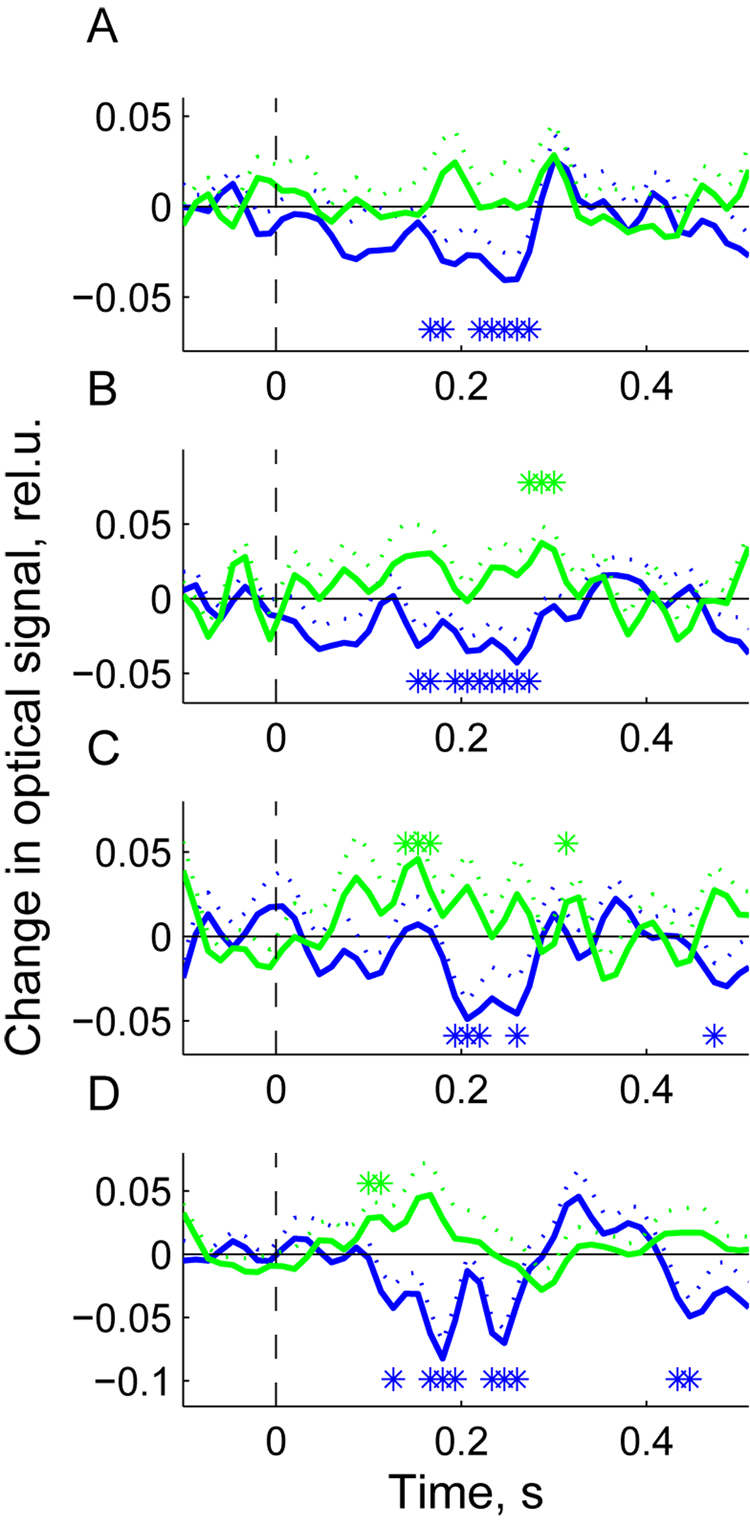
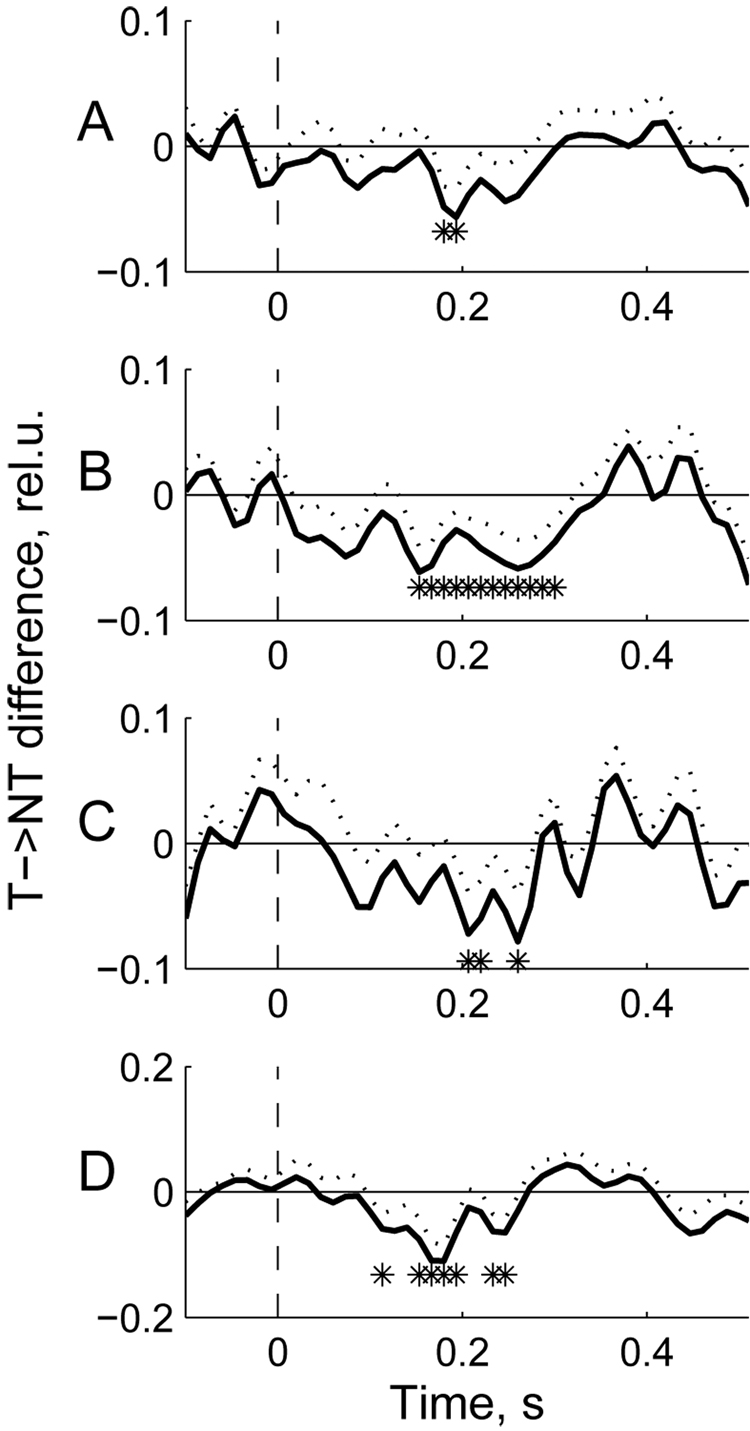
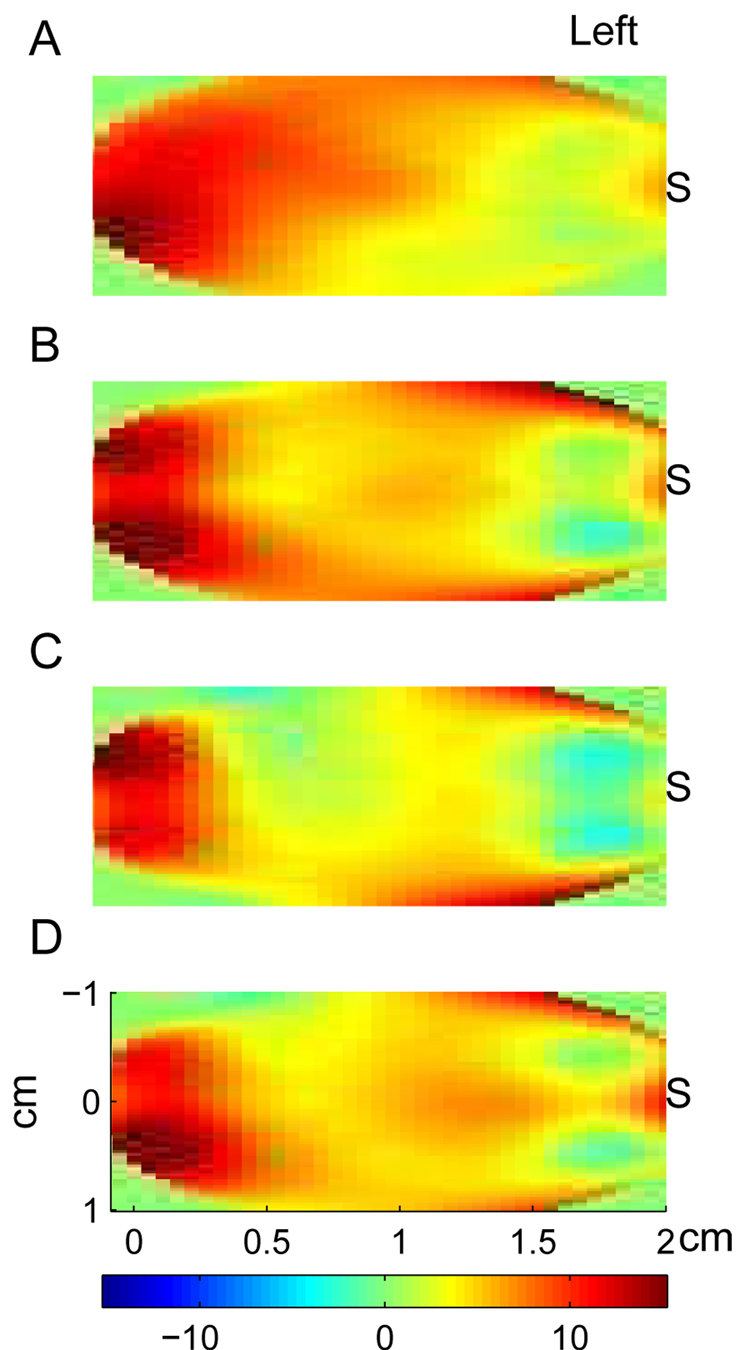
Noninvasive recording of fast optical signals presumably reflecting neuronal activity is a challenging task because of a relatively low signal-to-noise ratio. To improve detection of those signals in rapid object recognition tasks, we used the independent component analysis (ICA) to reduce "global interference" (heartbeat and contribution of superficial layers). We recorded optical signals from the left prefrontal cortex in 10 right-handed participants with a continuous-wave instrument (DYNOT, NIRx, Brooklyn, NY). Visual stimuli were pictures of urban, landscape and seashore scenes with various vehicles as targets (target-to-non-target ratio 1:6) presented at ISI=166 ms or 250 ms. Subjects mentally counted targets. Data were filtered at 2-30 Hz and artifactual components were identified visually (for heartbeat) and using the ICA weight matrix (for superficial layers). Optical signals were restored from the ICA components with artifactual components removed and then averaged over target and non-target epochs. After ICA processing, the event-related response was detected in 70%-100% of subjects. The refined signal showed a significant decrease from baseline within 200-300 ms after targets and a slight increase after non-targets. The temporal profile of the optical signal corresponded well to the profile of a "differential ERP response", the difference between targets and non-targets which peaks at 200 ms in similar object detection tasks. These results demonstrate that the detection of fast optical responses with continuous-wave instruments can be improved through the ICA method capable to remove noise, global interference and the activity of superficial layers. Fast optical signals may provide further information on brain processing during higher-order cognitive tasks such as rapid categorization of objects.


Figures

Fig. 1
Fig. 1
Optical probe on the head of a subject (top) and schematic drawing of the probe position and geometry (bottom). Position of the light source is marked by asterisk and the area used to reconstruct the spatial distribution of the fast optical signal is depicted by rectangular. This area is defined as to over midpoint locations for all source-detector pairs and the activity recorded at each detector is assumed to be “located” at the midpoint of the corresponding source-detector distance.
Fig. 2
Fig. 2
(A) Fifteen channels of raw optical data for wavelength = 830 nm recorded from a representative subject (#39). Note the presence of regular waves with a period of slightly shorter then 1 s in almost all channels (marked by asterisks in channel #12). Those waves are caused by regular changes in blood oxygenation due to the heartbeat. (B) Independent components of the same data. Note that the heartbeat rhythm is present mainly in components #2 (marked by asterisks), #6, #10 and to a weaker extent in components #12 and #15. (C) First two seconds of the same record are shown with a superposition of the raw data (thin line) and the restored data with artifactual components removed (bold line). Note a significant reduction of heartbeat waves in the restored signal. Signals are baseline corrected and normalized to standard deviation.
Fig. 3
Fig. 3
(A)The grayscale-coded plot of weight matrix A for data shown in Fig 2. (B–E) Matrices Aaveraged over all subjects for each of four experimental conditions: PR=6 Hz, wavelength=760 nm (B); PR=6 Hz, wavelength=830 nm (C); PR=4 Hz, wavelength=760 nm (D) and PR=4 Hz,wavelength=830 nm (E). Each cell in the plots represents coefficient aij of matrix A. Oval “a” represents one cluster of relatively large weights describing the contribution of several components into the activity of co-located channel (#2) and other channels located close to the source. The activity within this cluster is largely contaminated by the activity of superficial layers. Oval “b” represents the activity of channels distant from the source. These two clusters of activity were commonly found in all subjects and can be seen in group average matrices (B–E).
Fig. 4
Fig. 4
Power spectra of the data presented in Fig 2 before (thin line) and after artifact removal (bold line). Heartbeat-related artifact present in the raw data is seen as two high amplitude peaks at low frequencies (2–3 Hz). Those peaks are the 2nd and the 3rd harmonics of the heartbeat rhythm. Note a marked reduction in power of both the heartbeat and broadband noise after ICA. Spectra for channels ## 10–12 are shown using logarithmic scale along y-axis to show the spectra after ICA in more detail.
Fig. 5
Fig. 5
Event-related signal (averaged over all target epochs (bold line) and the same number of randomly chosen non-target epochs (dotted line)) calculated using the raw data (A) and the ICA-processed data (B) in subject #37. Stimulus is presented at t = 0 (picture onset). Significant deviations from baseline (100 ms pre-stimulus) are marked by asterisks. Note that averaging of the raw data does not reveal any event-related signal while averaging of the ICA-processed data reveals significant deviations from baseline for both target and non-target stimuli. Signal amplitude scale is in units of ΔI/I0 (%).
Fig. 6
Fig. 6
Group average event-related responses for presentation rate (PR) = 6 Hz and wavelength = 760 nm, N = 8 (A); PR = 6 Hz and wavelength = 830 nm, N = 10 (B); PR = 4 Hz and wavelength = 760 nm, N = 7 (C); PR = 4 Hz and wavelength = 830 nm, N = 7 (D). N is the number of subjects used in each of four conditions to derive the group average response. Only subjects showing a significant response were used in group averaging. Stimulus is presented at t = 0 (picture onset). Blue line – response to targets; green line – response to non-targets; dotted lines show standard errors for the corresponding signals at each time point; asterisks designate time bins with significant deviation of responses from baseline (t-test, p < 0.05). Signal amplitude scale is in units of ΔI/I0 (%).
Fig. 7
Fig. 7
Group average differential responses (target minus non-target) for the data shown in Fig 6.Dotted lines show standard errors for the corresponding signals at each time point; asterisks designate time bins with significant difference between targets and non-targets (t-test, p < 0.05).
Fig. 8
Fig. 8
Group average spatial maps of the fast optical signal. Panels A–B correspond to the panels in Fig 6 and Fig 7. Spatial maps were calculated for each subject using relative weights of the ICA component contributing to the observed event-related response with the largest weight. To calculate spatial distribution, those weights were interpolated over the area covering midpoint locations for all source-detector pairs (see Fig 1). S is location of the light source. Note that the observed event-related response is best seen at detectors distant from the source (3–4 cm source-detector separation) while the contribution into the response of superficial layers (activity of which is best seen at detectors close to the source) is minimized through the ICA.

References

    1. Aronson R, Barbour RL, Lubowsky J, Graber HL. Application of transport theory to infrared medical imaging; Proc. 11th International Conference on Transport Theory. Operator Theory: Advances and Applications; May 22–26, 1989; Blacksburg, VA: Birkhauser Verlag Press; 1991. pp. 64–75.
    1. Baba JS, Cameron BD, Theru S, Coté GL. Effect of temperature, pH, and corneal birefringence on polarimetric glucose monitoring in the eye. J Biomed Optics. 2002;7:321–328. - PubMed
    1. Baert AL, editor. Encyclopedia of Diagnostic Imaging. Berlin: Springer; 2008.
    1. Barbour RL, Graber HL, Aronsonza R, Lubowsky J. Model for 3-D optical imaging of tissue; Int. Geosci. and Remote Sensing Symp. (IGARSS); 1990. pp. 1395–1399.
    1. Barbour RL, Graber HL, Aronson R, Lubowsky J. Imaging of subsurface regions of random media by remote sensing. Time-Resolved Spectroscopy and Imaging of Tissues; Proc Soc Photo Opt Instrum Eng; SPIE; 1991. pp. 192–203.

Publication types