Review
. 2008 Sep;27(5):501-26.
doi: 10.1016/j.preteyeres.2008.07.002. Epub 2008 Aug 3.

Endocannabinoids in the retina: from marijuana to neuroprotection

Affiliations
Review

Endocannabinoids in the retina: from marijuana to neuroprotection

Stephen Yazulla. Prog Retin Eye Res. 2008 Sep.

Abstract

The active component of the marijuana plant Cannabis sativa, Delta9-tetrahydrocannabinol (THC), produces numerous beneficial effects, including analgesia, appetite stimulation and nausea reduction, in addition to its psychotropic effects. THC mimics the action of endogenous fatty acid derivatives, referred to as endocannabinoids. The effects of THC and the endocannabinoids are mediated largely by metabotropic receptors that are distributed throughout the nervous and peripheral organ systems. There is great interest in endocannabinoids for their role in neuroplasticity as well as for therapeutic use in numerous conditions, including pain, stroke, cancer, obesity, osteoporosis, fertility, neurodegenerative diseases, multiple sclerosis, glaucoma and inflammatory diseases, among others. However, there has been relatively far less research on this topic in the eye and retina compared with the brain and other organ systems. The purpose of this review is to introduce the "cannabinergic" field to the retinal community. All of the fundamental works on cannabinoids have been performed in non-retinal preparations, necessitating extensive dependence on this literature for background. Happily, the retinal cannabinoid system has much in common with other regions of the central nervous system. For example, there is general agreement that cannabinoids suppress dopamine release and presynaptically reduce transmitter release from cones and bipolar cells. How these effects relate to light and dark adaptations, receptive field formation, temporal properties of ganglion cells or visual perception are unknown. The presence of multiple endocannabinoids, degradative enzymes with their bioactive metabolites, and receptors provides a broad spectrum of opportunities for basic research and to identify targets for therapeutic application to retinal diseases.


Figures

Fig. 1
Fig. 1
Chemical structures of three endocannabinoids: arachidonoyl-ethanolamide (Anandamide, AEA), 2-arachidonoyl-glycerol (2-AG) and N-arachidonoyl-dopamine (NADA).
Fig. 2
Fig. 2
This schematic illustrates some of the metabolic pathways of the degradation of AEA and 2-AG. In the dominant pathways (bold arrows), AEA and 2-AG are hydrolyzed to arachidonic acid (AA) and then rapidly incorporated into membrane phospholipids via N-acyltransferase (NAT) and Acyl-Coenzyme A synthetase. Lesser pathways (shaded arrows) involve oxidation by cyclooxygenase-2 (COX-2) of AEA, 2-AG and AA to prostaglandins (PGE2 and PGD2). Additionally, AA may be oxidized by lipoxygenase (LOX) to 12-(S)- and 15-(S)-HPETE and 5-(S)-HETE. Hollow arrows show that AEA and 2-AG are endoligands for CB1, CB2 and PPAR receptors, while AEA also activates TRPV1 receptors. Metabolites of COX-2 oxidation activate EP2 receptors, and metabolites of LOX oxidation activate TRPV1 receptors.
Fig. 3
Fig. 3. Localization of CB1R-IR in mouse retina (unpublished observation)
CB1R-IR was observed over the photoreceptor inner segments, the outer plexiform layer (OPL), scattered cell bodies in the inner nuclear layer (INL), in two broad bands in the inner plexiform layer (IPL) and cells in the ganglion cell layer (GCL). We found that CB1R-IR in the vertical streaks in the INL and IPL, along with cell bodies in the distal INL was co-localized with PKC-IR, and thus are rod bipolar cells. With the exception of CB1RIR in mouse ganglion cells, this pattern is very similar to what was reported in rat retina with this same CB1 antiserum (Yazulla et al., 1999). Cal bar = 10 μm.
Fig. 4
Fig. 4. Distribution of CB1R-IR in goldfish retina (from Yazulla et al., 2000)
A) Preadsorption of the CB1 antiserum with the immunizing peptide antigen abolished CB1R-IR over the entire retina except for the bright band over the basal lamina, indicating non-specific labeling in this region. ONL — outer nuclear layer, OPL — outer plexiform layer, INL — inner nuclear layer, IPL — inner plexiform layer, GCL — ganglion cell layer. Calibration bar for A and B = 20 μm. B) CB1R-IR was prominent over cell bodies in the proximal margin of the INL, diffuse labeling over cone cell bodies, but not rod cell bodies in the ONL, as well as diffuse and punctate labeling in the OPL (white arrows) and IPL. The streaks of CB1R-IR that extended vertically through the retina were identified as Müller's cells (black arrow). Bright patches of CB1R-IR in the proximal IPL (arrowheads) were identified as the synaptic terminals of Mb bipolar cells by double labeling with PKC-IR. C. Electron micrograph of CB1R-IR in the outer plexiform layer of goldfish retina. Membrane associated CB1R-IR (arrowhead) was located away from a synaptic ribbon (small arrow). H — horizontal-cell dendrite. Calibration bar = 0.5 μM. D. Electron micrograph of CB1R-IR in the inner plexiform layer of goldfish retina. CB1R-IR in the presynaptic terminal of an Mb bipolar cell was along the bipolar cell membrane (arrowheads) that was apposed to two amacrine cell processes (ac). Calibration bar = 0.25 μm.
Fig. 5
Fig. 5. Distribution of endocannabinoid metabolizing enzymes in mouse retina. (unpublished observations)
A. FAAH — FAAH-IR was absent in the FAAH knockout (KO) mouse, attesting to the specificity of the FAAH antisera. The distribution of FAAH-IR in wild type (WT) retina was essentially identical to that in rat retina with this antisera (Yazulla et al 1999). The most prominent label was in virtually all cells in the ganglion cell layer (GCL), bipolar cells, rod inner segments and nuclei, and lighter label over amacrine cell bodies in the proximal inner nuclear layer (INL, not seen in this section) and in a band in the middle of the inner plexiform layer (IPL). As in rat (Yazulla et al 1999), FAAH-immunoreactive bipolar cells in mouse are not PKC-immunoreactive and thus are cone BC rather than rod BC. Cal bar = 10 μm. B. MGL — MGL-IR was absent after preadsorption of the MGL antiserum with the immunizing peptide antigen. MGL-IR was prominent over ganglion cells in the GCL and proximal INL and in rod bipolar cells (these colocalize with PKC-IR). MGL-IR was far less intense on bipolar cell axons and dendrites of amacrine and ganglion cells. There were numerous MGL-immunoreactive boutons throughout the IPL that could not be assigned to any particular cell type. C. COX-2 — No COX-2-IR was observed in retinas after preadsorption of the COX-2 antiserum with the immunizing peptide antigen. The distribution of COX-2-IR was most prominent over several layers of bipolar cell bodies in the INL and their axons in the IPL. Double labeling with PKC-IR showed that COX-2-immmunoreactive bipolar cells were a mixed population of rod bipolar cells and cone bipolar cells.
Fig. 6
Fig. 6. FAAH-IR in the goldfish retina (from Glaser et al., 2005a)
A. Preadsorption of the FAAH antisera with peptide antigen revealed heavy labeling over horizontal cell axon terminals (HAT) in the middle of the inner nuclear layer (INL) and weak label over cone ellipsoids (E — arrows), indicating non-specific labeling of these structures. B. FAAH-IR was prominent in the perinuclear region of cone inner segments (IS), vertical fibers (arrowheads) that extended from the outer limiting membrane (OLM) through the inner plexiform layer (IPL) and cell bodies at the proximal INL that were identified as processes of Müller's cells by double labeling with GFAP. There were also labeled amacrine cells (arrows — A). Inner segment — IS, Outer limiting membrane — OLM, Outer nuclear layer — ONL, Outer plexiform layer — OPL, Horizontal cell axon terminals — HAT, inner plexiform layer — IPL. Scale bar = 20 μm.
Fig. 7
Fig. 7. In vitro autoradiographs of 3H-AEA uptake in intact goldfish retina, incubated at 20°C at two exposures. The silver grain pattern represents the deposition of 3H-AEA and its metabolites (from Glaser et al., 2005a)
A. At 60 days exposure, there was a relative increase in grain density over cone inner segments (IS, open arrowhead). Despite numerous grains in the outer nuclear layer (ONL), rod nuclei tended to be surrounded by grains rather than filled with them, suggestive of Müller's cell processes. There were also streaks of grains through the inner nuclear layer (INL), inner plexiform layer (IPL) to the optic fiber layer (OFL). Also note there was a complete lack of grain deposition over the axon terminals of horizontal cells (HAT, black arrowheads) in the mid INL. B. At 151 days exposure, a grain pattern indicative of Müller's cells was far more apparent, with clusters of grains at the outer limiting membrane (OLM) and prominent vertical streaks through the retina, particularly in the INL and IPL and along the end feet at the inner limiting membrane. There appeared to be labeled cell bodies in the proximal INL (arrows), but their identity as amacrine or Müller's cells is not clear. A relative lack of label over rod nuclei and HAT was still apparent even at this long exposure. Scale bar = 20 μm.
Fig. 8
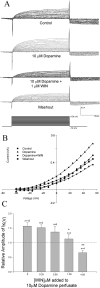
Fig. 8. Interaction of WIN 55,212−2 and dopamine on IK(V) in goldfish Mb bipolar cells (from Fan and Yazulla, 2005)
WIN 55,212−2 blocked the enhancing effect of 10 μM dopamine on IK(V) as illustrated in the current records (A) and I-V curves (B) for one Mb bipolar cell. Application of 10 μM dopamine enhanced IK(V). The addition of 1 μM WIN 55,212−2 suppressed IK(V), blocking the effect of dopamine. There was a return to control with washout of drugs. Depolarizing steps were applied from a holding potential of −70 mV. The sequence of conditions is indicated, in order, by the identified symbols in the upper left side of the I-V axis. C. WIN 55,212−2 blocked the enhancing effect of 10 μM dopamine on IK(V) in a concentration dependent manner. In these experiments, the amplitude of IK(V) was measured in response to application of 10 μM dopamine and again after the addition of the nominal concentration of WIN 55,212−2, as indicated on the abscissa. Each Mb bipolar cell was subjected to only one concentration of WIN 55,212−2. The effect of 10 μM dopamine was effectively negated at 1 μM WIN 55,212−2 (p < 0.05; n=5) and reversed to an net inhibition at 4 μM WIN 55,212−2 (p < 0.01; n=4). Depolarizing steps to +48 mV were applied from a holding potential of −70 mV. Current amplitudes are plotted relative to that elicited in the absence of dopamine. “0” on the abscissa is the response to 10 μM dopamine in the absence of any WIN 55,212−2.
Fig. 9
Fig. 9. Reversible biphasic effects of WIN 55,212−2 on voltage-dependent currents in goldfish cones (from Fan and Yazulla, 2003)
A, B. IK(V) was increased by WIN 55,212−2 at concentrations < 1 μM (A), and was decreased at concentrations > 1 μM (B). The effect of WIN 55,212−2 was mostly on the amplitude of IK(V); the activation ranges appeared unaffected. Note, that control amplitudes were achieved with washout of WIN 55,212−2. C, D. ICa was increased by WIN 55,212−2 at concentrations < 1μM (C) and decreased at concentrations > 1 μM (D). As with IK(V), only the amplitude of ICa was affected; there appeared to be no effect on the voltage-activation range. A concentration of 1 μM was the crossover from enhancement to suppression for IK(V and ICa.
Fig. 10
Fig. 10. Properties of the retrograde responses of cones (from Fan and Yazulla, 2007)
A. An illustration of the method used to detect retrograde responses in goldfish cones in a retinal slice. Whole cell recordings of IK(V) were obtained from long-single cones (long arrow). A puff pipette, containing 70 mM KCl, was positioned slightly upstream and at the cell body of a Mb bipolar cell (short arrow). Thin arrows indicate the synaptic terminals of Mb bipolar cells. OPL — outer plexiform layer, IPL — inner plexiform layer. Calibration bar = 20 μm. B, C. Sequential and overlay of raw records of IK(V) from a single cone evoked by a 50 msec depolarizing pulse to +54 mV from a holding potential of −70 mV. The records have not been normalized. A 50 msec K+ puff was delivered twice. IK(V) in response to K+ puff #1 was reduced compared to that evoked for the pre-puff control #1. The cone was allowed to recover for 30 min after K+ puff #1. IK(V) returned to control amplitude (C2, Control #2). The K+ puff #2 produced an equivalent reduction in IK(V). D. Time course (log scale) of the reduction of IK(V) in response to a single 50 msec puff of K+ shows a latency of about 200 msec following the puff, a peak response at about 500 msec and a gradual return to control level by 5 min. E. Effect of K+ puff duration on IK(V). These data were obtained from a single cone over 4 hours. After a pre-puff control value of IK(V) was obtained, a 25 msec K+ puff was administered and the effect on IK(V) was determined. The cell was allowed to recover for 30 min and another pre-puff control and a K+ puff of a longer duration was administered. This sequence was followed for all puff durations. Thus, the value plotted for each puff-duration is relative to its own pre-puff control. There was no effect with a puff of ≤ 25 msec duration. Near maximal suppression of IK(V) at about 25% was achieved with a puff of 50 msec and there was little additional effect with puffs as long as 200 msec.
Fig. 11
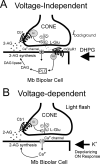
Fig. 11. Schematic illustrations of proposed modulation of retrograde release of 2-AG from Mb bipolar cell dendrites (from Fan and Yazulla, 2007)
A. Voltage-independent — Under any steady background illumination (Ibackground), there will be basal release of L-glutamate (L-Glu) from the cones. Independent of any other glutamate receptors on Mb bipolar cells, L-Glu will activate mGluR1 that, via a Gq/11 cascade involving phospholipase C (PLC), will result in a calcium dependent synthesis and release of 2-AG from the Mb bipolar cell plasma membrane. Upon release, 2-AG will activate pre-synaptic CB1 receptors on the cone pedicle with a resulting inhibition of membrane currents via Gi/o. The effect will be a negative feedback that maintains L-Glu release within some limit. B. Voltage-dependent — In response to an increase in light intensity, there will be a reduction in the release of L-Glu from the cone, resulting in a depolarizing response in the Mb bipolar cell. The depolarization could open Ca2+ channels resulting in the synthesis and release of 2-AG from the Mb bipolar cell. Retrograde inhibition of cone transmitter release would be a positive feedback, enhancing the light response. As the retrograde effect has a slow onset and is long-lasting, the voltage-dependent mechanism may be of less relevance compared with the negative feedback maintenance of L-Glu release that would result from the Voltage-independent mechanism.
Fig. 12
Fig. 12. Effect of WIN 55,212−2 on the responses of goldfish cones in an isolated retinal preparation to flashes of light (from Struik et al., 2006)
A. Voltage-light responses of an L-cone under current clamp to a 200 ms light stimulus of different intensities for Control conditions and after 8 min in 10 μM WIN 55,212−2. Indicated at the right are relative stimulus intensities. The response amplitudes in the Control and WIN conditions differed from each other by about 10%. To facilitate comparison, the traces were normalized and superimposed. Except for the dimmest intensity, there was a speeding up of the response to light offset and an enhancement of the overshoot at two intermediate intensities. There was no effect on the response to light onset or on the plateau phase of the response. The 5 mV calibration refers to the control response. B. Current-light responses of an L-cone at different holding potentials to a 200 ms light stimulus of approximately half-maximal intensity in Control and 10 μM WIN 55,212−2. The timing of the light stimulus is indicated at the bottom of the figure. The amplitude of the light response decreased with decreasing holding potential because the holding potential approached the reversal potential of the photocurrent. The response amplitudes in the Control and WIN conditions differed from each other by 5−20%. To facilitate comparison, the traces were normalized and superimposed. Speeding up of the response to light offset in response to WIN 55,212−2 is apparent at all holding potentials. There was no effect of WIN 55,212−2 on the response to light onset or plateau phases of the light response. The holding potential did not change the kinetics of the light responses. The 100 pA calibration refers to the control response.

Similar articles

Cited by

References

    1. Adams AJ, Brown B. Alcohol prolongs time course of glare recovery. Nature. 1975;257:481–483. - PubMed
    1. Adams AJ, Brown B, Flom MC, Jampolsky A. Alcohol and marijuana effects on static visual acuity. Am. J. Opt. Physiol. Optics. 1975;52:729–735. - PubMed
    1. Adams AJ, Brown B, Haegerstrom-Portnoy G, Flom MC, Jones RT. Marijuana, alcohol, and combined drug effects on the time course of glare recovery. Psychopharmacology (Berl) 1978;56:81–86. - PubMed
    1. Aguado T, Romero E, Monory K, Palazuelos J, Sendtner M, Marsicano G, Lutz B, Guzmán M, Galve-Roperh I. The CB1 cannabinoid receptor mediates excitotoxicity-induced neural progenitor proliferation and neurogenesis. J. Biol. Chem. 2007;282:23892–23898. - PubMed
    1. Ahmad AS, Zhuang H, Echeverria V, Doré S. Stimulation of prostaglandin EP2 receptors prevents NMDA-induced excitotoxicity. J. Neurotrauma. 2006;23:1895–1903. - PubMed

LinkOut - more resources