. 2008 Nov;25(11):2409-19.
doi: 10.1093/molbev/msn185. Epub 2008 Aug 25.

Estimation of nucleotide diversity, disequilibrium coefficients, and mutation rates from high-coverage genome-sequencing projects

Affiliations

Estimation of nucleotide diversity, disequilibrium coefficients, and mutation rates from high-coverage genome-sequencing projects

Michael Lynch. Mol Biol Evol. 2008 Nov.

Abstract

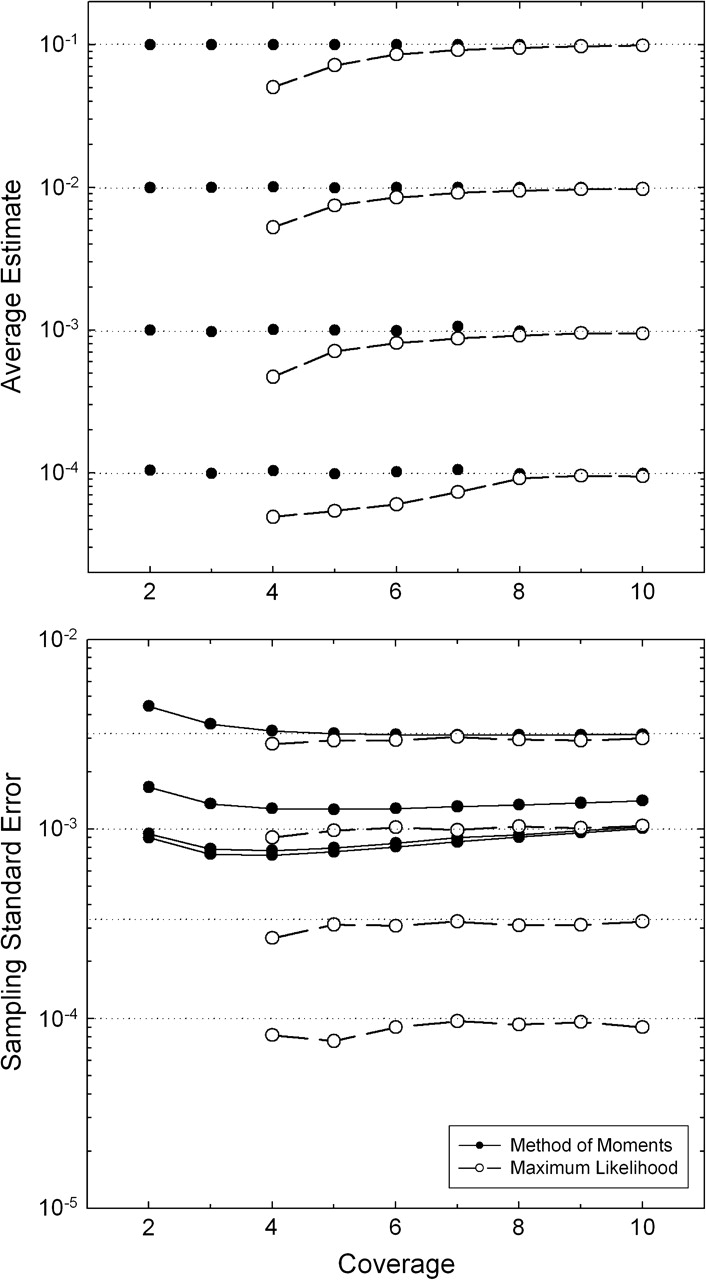
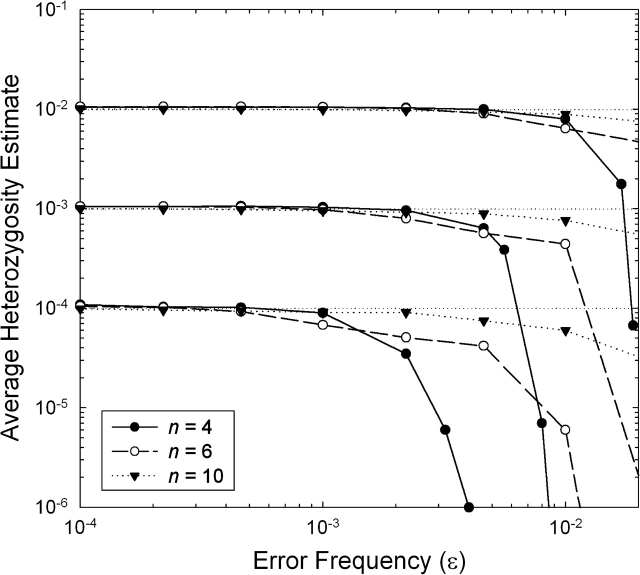
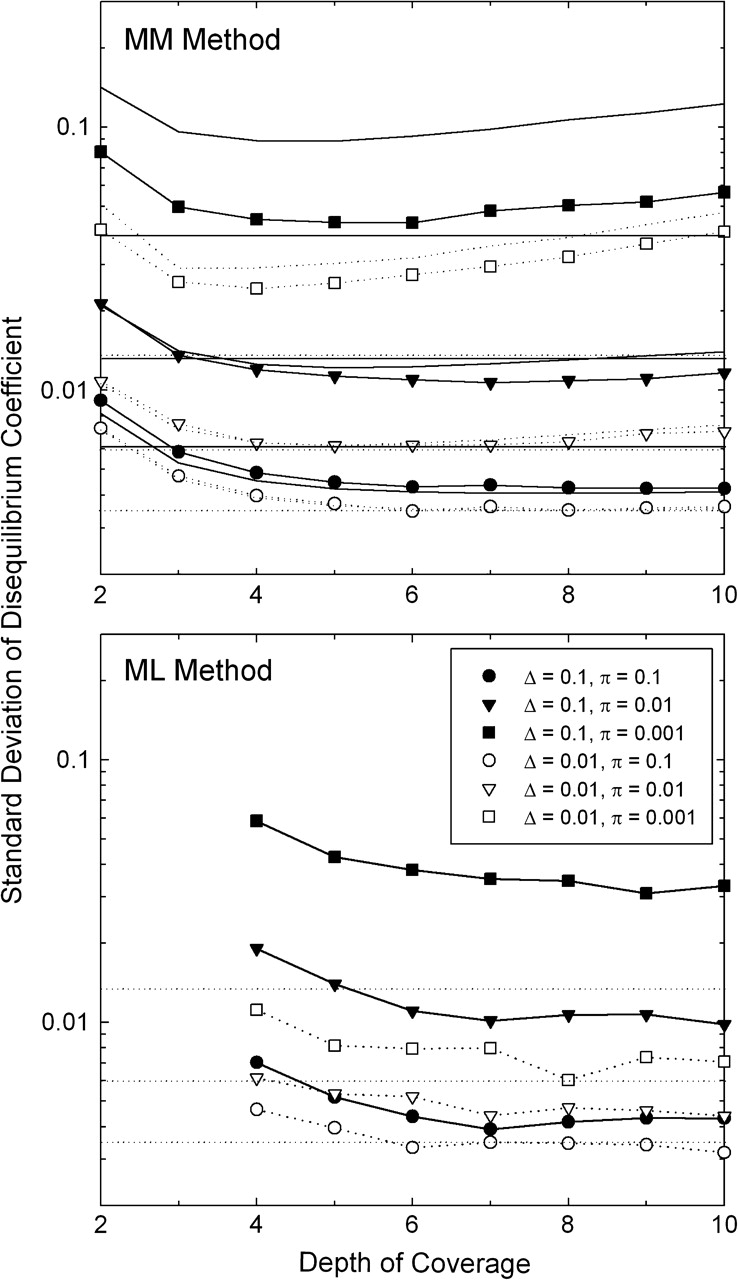
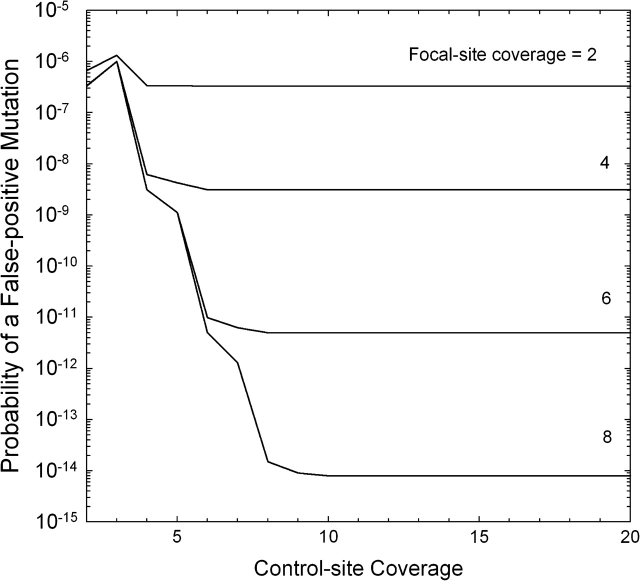
Recent advances in sequencing strategies have made it feasible to rapidly obtain high-coverage genomic profiles of single individuals, and soon it will be economically feasible to do so with hundreds to thousands of individuals per population. While offering unprecedented power for the acquisition of population-genetic parameters, these new methods also introduce a number of challenges, most notably the need to account for the binomial sampling of parental alleles at individual nucleotide sites and to eliminate bias from various sources of sequence errors. To minimize the effects of both problems, methods are developed for generating nearly unbiased and minimum-sampling-variance estimates of a number of key parameters, including the average nucleotide heterozygosity and its variance among sites, the pattern of decomposition of linkage disequilibrium with physical distance, and the rate and molecular spectrum of spontaneously arising mutations. These methods provide a general platform for the efficient utilization of data from population-genomic surveys, while also providing guidance for the optimal design of such studies.


Figures

F<sc>IG</sc>. 1.—
FIG. 1.—
Behavior of the MM (solid circles) and ML (open circles) estimators of π, given for four values of the true nucleotide heterozygosity, π = 0.1, 0.01, 0.001, and 0.0001, with all four nucleotides assumed to have equal genome-wide frequencies. In all cases, each of N = 10,000 sites was assumed to be sequenced to the same depth of coverage (n), and simulations were performed on 500–2,000 stochastic samples. In the upper panel, the horizontal dotted lines denote the true value of π, whereas in the lower panel, they denote the true within-individual sampling SE of mean heterozygosity, π(1π)/N. The assumed error rate is ϵ = 0.001.
F<sc>IG</sc>. 2.—
FIG. 2.—
Average ML estimates of π given for three values of the true nucleotide heterozygosity, π = 0.01, 0.001, and 0.0001 (denoted by the three horizontal dotted lines), with all four nucleotides assumed to have equal genome-wide frequencies and correction for sampling bias as described in the text. In all cases, each of N = 100, 000 sites is assumed to be sequenced to the same depth of coverage (n). The assumed error rate is ϵ = 0.001.
F<sc>IG</sc>. 3.—
FIG. 3.—
Sampling standard deviations associated with estimates of the disequilibrium coefficient Δ. Symbols refer to results obtained by stochastic simulations assuming 100,000 sites, with 2,500 replications performed for each condition with the MM method and 250–500 with the ML method. Curved lines without points in the upper panel give the results from the large sample–variance approximation for the MM estimates, equation (10b); and horizontal lines give the first-order high-coverage approximation, equation (10c). In both these latter cases, solid and dotted lines refer to situations with Δ = 0.1 and 0.01, respectively. To ease the comparison of results, the dotted lines are repeated in the lower panel. The assumed error rate is ϵ = 0.001.
F<sc>IG</sc>. 4.—
FIG. 4.—
Probability of a false-positive mutation call from a consensus-sequence comparison, given as a function of the number of reads at the site in the focal line and the composite control (the sum of the pooled samples from the remaining L − 1 lines). The error rate (ϵ) is assumed to equal 0.001.

References

    1. Bentley DR. Whole-genome re-sequencing. Curr Opin Genet Dev. 2006;16:545–552. - PubMed
    1. Briggs AW, et al. (11 co-authors) Patterns of damage in genomic DNA sequences from a Neandertal. Proc Natl Acad Sci USA. 2007;104:14616–14621. - PMC - PubMed
    1. Clark AG, Whittam TS. Sequencing errors and molecular evolutionary analysis. Mol Biol Evol. 1992;9:744–752. - PubMed
    1. Ewing B, Green P. Base-calling of automated sequencer traces using phred. II. Error probabilities. Genome Res. 1998;8:186–194. - PubMed
    1. Ewing B, Hillier L, Wendl MC, Green P. Base-calling of automated sequencer traces using phred. I. Accuracy assessment. Genome Res. 1998;8:175–185. - PubMed

Publication types

LinkOut - more resources