. 2008 Sep;135(18):3081-91.
doi: 10.1242/dev.021519.

Distinct sequential cell behaviours direct primitive endoderm formation in the mouse blastocyst

Affiliations

Distinct sequential cell behaviours direct primitive endoderm formation in the mouse blastocyst

Berenika Plusa et al. Development. 2008 Sep.

Abstract

The first two lineages to differentiate from a pluripotent cell population during mammalian development are the extraembryonic trophectoderm (TE) and the primitive endoderm (PrE). Whereas the mechanisms of TE specification have been extensively studied, segregation of PrE and the pluripotent epiblast (EPI) has received comparatively little attention. A current model of PrE specification suggests PrE precursors exhibit an apparently random distribution within the inner cell mass of the early blastocyst and then segregate to their final position lining the cavity by the late blastocyst. We have identified platelet-derived growth factor receptor alpha (Pdgfralpha) as an early-expressed protein that is also a marker of the later PrE lineage. By combining live imaging of embryos expressing a histone H2B-GFP fusion protein reporter under the control of Pdgfra regulatory elements with the analysis of lineage-specific markers, we investigated the events leading to PrE and EPI lineage segregation in the mouse, and correlated our findings using an embryo staging system based on total cell number. Before blastocyst formation, lineage-specific factors are expressed in an overlapping manner. Subsequently, a gradual progression towards a mutually exclusive expression of PrE- and EPI-specific markers occurs. Finally, cell sorting is achieved by a variety of cell behaviours and by selective apoptosis.


Figures
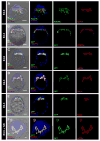
Fig. 1
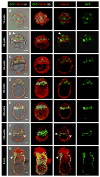
Fig. 1. Pdgfrα is localised to the PrE layer of E4.0 blastocysts and blastocyst outgrowths
(A) Pdgfrα is co-expressed with Gata4 in the PrE of E4.0–4.5 blastocysts. (B–E) Co-expression of GFP in E4.0 and E4.5 Pdgfrα H2B-GFP/+ embryos with Pdgfrα protein (B), and with the PrE markers Gata6 (C), Gata4 (D) and Dab2 (E). (F) GFP is co-expressed with Gata4 in Pdgfrα H2B-GFP/+ blastocyst outgrowths after 72 hours of culture. Each row represents one embryo. All panels show single optical sections. bf, bright field; green, Pdgfrα (A) and GFP (B–F); red, Pdgfrα (B), Gata4 (A,D,F), Gata6 (C) and Dab2 (E); blue, Hoechst. Scale bar: 20 μm.
Fig. 2
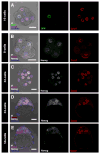
Fig. 2. Expression of GFP in live Pdgfrα H2B-GFP/+ embryos during pre- and early postimplantation development
(A–C) Heterogeneous GFP distribution in a 16-cell morula (A), a 36-cell early blastocyst (B; arrowhead indicates GFP-expressing TE cell) and a 64-cell mid-blastocyst (C). (D) In an ~80-cell blastocyst, GFP-expressing cells are partially segregated to the prospective PrE layer. (E,F) In an ~100-cell blastocyst (E), GFP-expressing cells are restricted to the PrE layer and in a 120-cell blastocyst (F) they start to migrate along the mural TE (arrowheads). (G) At E5.5, GFP-positive cells occupy the visceral endoderm (arrowhead indicates remainder of GFP-positive parietal endoderm). The second column depicts 3D reconstructions of the z-stacks, other panels show single optical sections. bf, bright field; green, GFP; red, FM4-64. Scale bar: 20 μm.
Fig. 3
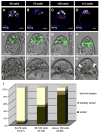
Fig. 3. Localisation of Nanog and Gata6 in embryos from 8-cell to blastocyst stage
(A) Gata6 and GFP expression in a 16-cell PdgfraH2B-GFP/+ embryo. (B) Gata6 and Nanog are co-expressed in 8-cell embryos. (C) In a 32-cell morula, Nanog and Gata6 show broad, overlapping expression. (D) In a 33-cell blastocyst, Nanog and Gata6 colocalise in some, but not all cells. (E) In a 58-cell blastocyst, Gata6 expression is mutually exclusive from that of Nanog. Each row represents a single optical section of one embryo. bf, bright field; green, GFP; white, Nanog; red, Gata6; blue, Hoechst. Scale bar: 20 μm.
Fig. 4
Fig. 4. Localisation of Nanog, Gata4 and GFP in PdgfraH2B-GFP/+ blastocysts
(A) In a 32-cell blastocyst, Nanog and GFP show broad, overlapping expression; Gata4 is undetectable. (B) Salt-and-pepper distribution of Nanog, Gata4 and GFP in a 64-cell blastocyst. Gata4 is expressed only in a subset of Nanog-negative and GFP-positive cells. (C) Partial segregation of Nanog-positive and Gata4-/GFP-positive cells in a 115-cell blastocyst. Gata4 and GFP are co-expressed in cells mostly localised to the nascent PrE layer. Nanog is expressed in the EPI layer and no longer colocalises with Gata4 or GFP. (D) In a 118-cell blastocyst, PrE markers (Gata4 and GFP) are co-expressed and mutually exclusive from the EPI marker Nanog; cells expressing PrE and EPI markers are fully restricted to their respective layers. Each row represents a single optical section of one embryo. bf, bright field; green, GFP; white, Nanog; red, Gata4 (A–D); blue, Hoechst. Scale bar: 20 μm. (E) Comparison of the number of Gata4- and Nanog-positive cells versus total cell number. An abrupt decrease in the number of Nanog-expressing cells at around the 64-cell stage coincides with the emergence of Gata4-expressing cells. Thereafter, the number of Nanog-expressing cells appears to increase only slightly, whereas the number of Gata4-expressing cells increases approximately linearly. (F) Comparison of the number of Gata4- and GFP-expressing cells with respect to total cell number.
Fig. 5
Fig. 5. Changes in EPI and PrE marker expression correlate with GFP-positive cell behaviour during in vitro culture of Pdgfrα H2B-GFP/+ blastocysts
(A–D) Immunolocalisation of Gata4 and Nanog in the ICM of embryos of 64 cells or more. (A) Salt-and-pepper distribution of Gata4 and Nanog in a 65-cell embryo. Some cells expressing Gata4 are also Nanog positive. (B) Salt-and-pepper distribution of Gata4 and Nanog in a 72-cell embryo. (C) Partial segregation of Gata4- and Nanog-positive cells in a 108-cell embryo. (D) Gata4- and Nanog-positive cells are completely segregated in a 115-cell embryo. (E–H) Changes in the GFP-positive cell distribution within the ICM of a PdgfraH2B-GFP/+ embryo dissected ~90 hpc, visualized by 3D time-lapse microscopy. From 20 minutes (E) to 235 minutes (F) of culture, GFP-positive cells are randomly distributed in the ICM. Then, after around 370 minutes, partial segregation of the GFP-positive cells to the layer of cells lining the cavity can be observed (G). Complete segregation of GFP-positive cells to the PrE layer is achieved by 575 minutes (H). (E′–H′) High-magnification views of ICMs of embryos at successive time-points E–H. (H′) PrE layer can be distinguished by different refractive properties on a phase contrast (bright field) image from EPI cells (arrowheads). Each row represents single section time-lapse images of the same embryo (E–H, GFP fluorescence overlaid on a bright-field image; E′–H′, bright-field image only). Green, GFP; red, Gata4; white, Nanog; blue, Hoechst. Scale bar: 20 μm. (I) Quantification of embryos exhibiting salt-and-pepper, partially sorted, or sorted distribution of PrE precursors relative to cell number.
Fig. 6
Fig. 6. Diverse behaviour of GFP-positive cells contributing to the PrE layer in PdgfraH2B-GFP/+ embryos
(A) 3D reconstructions of z-stacks taken during fluorescence time-lapse imaging of a single Pdgfrα H2B-GFP/+ blastocyst during PrE formation. GFP-positive cells are initially randomly distributed throughout the ICM, but then segregate progressively to the surface of the ICM in contact with the blastocyst cavity. Some GFP-positive cells stay on the cavity throughout the movie (dark blue dot). Note the intercalation of GFP-positive cells highlighted by magenta and red dots. During PrE layer formation, GFP-positive cells remaining in the EPI can undergo apoptosis (arrowhead) or downregulate GFP expression, in contrast to cells in the PrE, which upregulate GFP expression (pale blue dot). A weakly GFP-positive cell is shown migrating away from the cavity (yellow dot). Scale bar: 20 μm. (B) Relative contribution of different types of cell behaviour to PrE segregation.
Fig. 7
Fig. 7. Multi-step model of EPI/PrE lineage formation
Initial (16- to 32-cell stage) overlapping expression of lineage-specific transcription factors is followed by a progression towards a stabilised salt-and-pepper pattern of PrE (Gata6) and EPI (Nanog) expression (32- to 64-cell stage). Subsequently, stabilised Nanog or Gata6 expression biases cells towards a particular fate (~64-cell stage) and cell sorting proceeds, although positional signals (arrows) are still required to complete specification.

References

    1. Andrae J, Gallini R, Betsholtz C. Role of platelet-derived growth factors in physiology and medicine. Genes Dev. 2008;22:1276–1312. - PMC - PubMed
    1. Becker S, Casanova J, Grabel L. Localization of endoderm-specific mRNAs in differentiating F9 embryoid bodies. Mech Dev. 1992;37:3–12. - PubMed
    1. Chambers I, Silva J, Colby D, Nichols J, Nijmeijer B, Robertson M, Vrana J, Jones K, Grotewold L, Smith A. Nanog safeguards pluripotency and mediates germline development. Nature. 2007;450:1230–1234. - PubMed
    1. Chazaud C, Yamanaka Y, Pawson T, Rossant J. Early lineage segregation between epiblast and primitive endoderm in mouse blastocysts through the Grb2-MAPK pathway. Dev Cell. 2006;10:615–624. - PubMed
    1. Copp AJ. Interaction between inner cell mass and trophectoderm of the mouse blastocyst. I A study of cellular proliferation. J Embryol Exp Morphol. 1978;48:109–125. - PubMed

Publication types

Substances