. 2008 Sep 1;205(9):2125-38.
doi: 10.1084/jem.20080099. Epub 2008 Aug 25.

Limited tumor infiltration by activated T effector cells restricts the therapeutic activity of regulatory T cell depletion against established melanoma

Affiliations

Limited tumor infiltration by activated T effector cells restricts the therapeutic activity of regulatory T cell depletion against established melanoma

Sergio A Quezada et al. J Exp Med. .

Abstract

Interference with inhibitory immunological checkpoints controlling T cell activation provides new opportunities to augment cancer immunotherapies. Whereas cytotoxic T lymphocyte-associated antigen-4 blockade has shown promising preclinical and clinical results, therapeutic CD4(+)CD25(+) T reg cell depletion has failed to consistently enhance immune-based therapies. Using B16/BL6, a transplantable murine melanoma model, we show a dichotomy between the effects of T reg cell depletion on tumor rejection dependent on whether depletion occurs before (prophylactic) or after (therapeutic) tumor engraftment. Failure to promote rejection with therapeutic depletion is not related to lack of T reg cell depletion, to elimination of CD25(+) effector T cells, or to a failure to enhance systemic antitumor T cell responses, but correlates with failure of effector cells to infiltrate the tumor and increase the intratumor ratio of effector T cell/T reg cell. Finally, systemic antitumor responses generated upon therapeutic T reg cell depletion are significantly stronger than those generated in the presence of T reg cells, and are capable of eliciting rejection of established tumors after transfer into immunoablated recipients receiving combination immunotherapy. The data demonstrate a dissociation between measurable systemic responses and tumor rejection during CD25-directed T reg cell depletion, and suggest an alternative, clinically applicable strategy for the treatment of established tumors.


Figures

Figure 1.
Figure 1.
Therapeutic CD25+ depletion fails to synergize with Gvax/αCTLA-4 in rejection of established tumors. (A) Mice were injected with anti-CD25 mAb 4 d before or after challenge with B16/BL6, and then treated with Gvax/αCTLA-4 on days 8, 11, and 14. (B) Representative plot for the expression of CD25 and Foxp3+ by the CD4+ T cell compartment 4 d after treatment with 400 μg of anti-CD25 mAb. (C) Tumor growth was monitored over time for mice treated with Gvax/αCTLA-4 (black squares; n = 10), anti-CD25 d-4 and Gvax/αCTLA-4 (blue triangles; n = 10), and anti-CD25 d+4 plus Gvax/αCTLA-4 (inverted red triangles; n = 10). Data are representative of 3 independent experiments (n = 10 mice per group in all experiments).
Figure 2.
Figure 2.
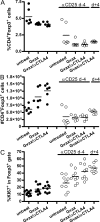
CD25 depletion prevents Gvax/αCTLA-4–induced T reg cell accumulation. Mice were injected with anti-CD25 mAb 4 d before or after challenge with B16/BL6, and then treated or not with Gvax or Gvax/αCTLA-4 on days 8 and 11, as shown in Fig. 1 A. LNs were analyzed for expression of CD4, Foxp3+, and KI-67 14 d after tumor challenge. Data in A represent the percentage of CD4+Foxp3+ cells obtained from individual mice. (B) The percentage of CD4+Foxp3+ T cells was multiplied by the total number of lymphocytes to calculate the absolute number of CD4+Foxp3+ T reg cells. Data in C represent the percentage of KI-67+ cells within the CD4+Foxp3+ compartment. Closed circles represent no depletion, and open circles represent CD25 depletion. Data are representative of 3 independent experiments (n = 3 mice per group).
Figure 3.
Figure 3.
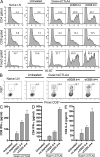
CD25 depletion promotes strong peripheral antitumor T cell reactivity. Mice were challenged with B16/BL6 melanoma and either left untreated or treated with Gvax/αCTLA-4 on days 8 and 11 after tumor implantation. Some groups also received anti-CD25 mAb 4 d before or after tumor challenge. (A) 14 d after tumor challenge, mice were analyzed for the expression of KI-67 within the CD4+Foxp3, CD8+, or CD4+Foxp3+ T cell compartments. (B) Mice were injected with congenically marked pmel Tg CD8+ T cells, treated as described in A, and analyzed for KI-67 expression on the pmel compartment 14 d after tumor challenge. Numbers on the top right of the histograms represent the percentage of cells expressing high levels of KI-67. (C–E) CD8+ and CD4+ T cells were purified from each experimental group described in A and restimulated in vitro with a mix of purified CD11c+ dendritic cells and irradiated B16 melanoma or control TRAMP-C2 tumor cell lines for 24 h. Production of IFN-γ by CD8+ (C) and CD4+ (D), and the production of IL-2 by CD4+ T cells (E), was determined as described in the Materials and methods. (A–C) Data are representative of 3 independent experiments (n = 3 mice per group).
Figure 4.
Figure 4.
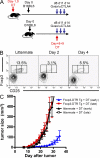
Therapeutic Foxp3-directed T reg cell depletion fails to synergize with Gvax/αCTLA-4 in rejection of established tumors. (A) Foxp3-DTR transgenic mice or littermate WT control were injected with 900 ng of DT on days −1 and 0 or 8 and 9, challenged with B16/BL6 at day 0, and treated with Gvax/anti–CTLA-4 on days 8, 11, and 14. (B) Representative plot for the expression of CD25 and Foxp3+ by the CD4+ T cell compartment on days 2 and 4 after DT injection. (C) Tumor growth was monitored over time in Foxp3-DTR or littermate mice challenged with B16 melanoma and treated with Gvax/αCTLA-4 on days 8, 11, and 14. Foxp3-DTR mice were also treated with DT early (blue triangles; n = 10) or late (red squares; n = 10), as described in A. Littermate controls were also treated with DT early (black triangle; n = 10) or late (black square; n = 10). Data are representative of 3 independent experiments (n = 10 mice per group).
Figure 5.
Figure 5.
Gvax/αCTLA-4 and CD25 depletion differentially impact intratumor T cell proliferation. Mice injected with anti-CD25 mAb 4 d before or after challenge with B16/BL6 were either left untreated or treated with Gvax/αCTLA-4 on days 8 and 11. 14 d after tumor challenge, tumors were isolated and analyzed for expression of KI-67 within the CD4+Foxp3, CD8+, or CD4+Foxp3+ T cell compartments. As a comparison, KI-67 profiles from LNs of naive mice are also shown. Numbers on the top right of the histograms represent the percentage of cells expressing high levels of KI-67. Data are representative of 3 independent experiments (n = 3 mice per group).
Figure 6.
Figure 6.
Efficient tumor infiltration and augmentation of the intratumor effector T cell/T reg cell ratio depends on timing of anti-CD25 administration. Mice challenged with B16/BL6 tumor cells were either left untreated or received anti-CD25 mAb 4 d before or after tumor challenge, plus Gvax/αCTLA-4 on days 8 and 11 and then killed 14 d after challenge. (A) Analysis of frozen tumor sections by confocal microscopy. Anti–CD8-Alexa-488 (green), anti-CD31 PE (red), and anti-CD11c APC (blue) are shown in the top row. Anti–CD4-Alexa-488 (green), anti-CD31 PE (red), and anti-Foxp3 (blue) are shown in the bottom row. Bar, 40 μm. (B, C, and D) In parallel experiments, tumors were harvested, processed for enrichment of TILs, and analyzed by flow cytometry for the expression of CD8, Foxp3, and CD45.1 (pmel transgenic cells). Tumors were pooled for each group, and data show the ratio of CD8+ cells to Foxp3+ cells infiltrating the tumors (B), the number of total CD8+ cells per gram of tumor (C), and the number of CD8+ pmel transgenic cells per gram of tumor (D). In E, mice were treated as described in A and analyzed for the expression of ICAM (green), CD31 (red), and VCAM (blue) within the tumors 14 d after challenge. Bar, 40 μm. All images were acquired with a 20× water immersion objective. Data are representative of 3 independent experiments (n = 3 mice per group).
Figure 7.
Figure 7.
CD25 depletion before tumor challenge promotes partial tumor infiltration in the absence of Gvax/αCTLA-4. Mice were challenged with B16/BL6 melanoma tumor cells and treated or not treated with anti-CD25 mAb 4 d before or after tumor challenge. 14 d after tumor implantation, tumors were harvested and analyzed for the expression of CD8 and Foxp3 by flow cytometry (A) or CD8 (green) and CD31 (red) by confocal microscopy (B). Bar, 100 μm.
Figure 8.
Figure 8.
Radiation therapy and CD25-depleted adoptive cell transfer synergize with Gvax/αCTLA-4 to reject established tumors. To generate the DLIs, tumor-bearing mice were injected or not injected with anti-CD25 on day 4 after challenge with B16/BL6 melanoma, and then treated with Gvax/αCTLA-4 on days 8, 11, and 14. 19 d after tumor challenge, T cells were isolated from donor mice and injected into mice bearing 8-d-old tumors. All mice receiving DLI were also treated with radiation therapy (RT) 8 h before the DLI. (A–E) Recipient mice were killed 18 d after tumor challenge. (A–C) Spleens were analyzed for expression of CD8, CD4, and Foxp3 using flow cytometry. All recipient mice were treated with Gvax/αCTLA-4 as described in the Materials and methods section. The groups were as follow: no RT no DLI (recipients receiving only Gvax/αCTLA-4 without RT or DLI), +RT no DLI (recipients receiving RT without DLI and then Gvax/αCTLA-4), +RT+DLI (recipients receiving RT, DLI, and Gvax/αCTLA-4), and +RT+DLI (αCD25) (recipients receiving RT, DLI from CD25-depleted donors, and Gvax/αCTLA-4). The data are presented as number of CD8+ cells (A), number of CD4+Foxp3+ T cells (B), and ratio of CD8+ T cells to CD4+Foxp3+ T cells (C). In D, CD8+ T cells were purified from the different groups and restimulated in vitro with irradiated B16 melanoma or control TRAMP-C2 tumor cell lines for 24 h. IFN-γ production was determined by ELISPOT assay, as described in the Materials and methods section. (E) Tumors were harvested from mice in the different groups, and frozen sections were stained with anti-VCAM FITC (green), anti-CD31 PE (red), and anti-ICAM APC (magenta) in the top row. The bottom row shows tumor sections stained with anti-CD8 Alexa Fluor 488 (green) and anti-CD31 PE (red). All images were acquired with a 20× water immersion objective. Bar, 40 μm. (F and G) In a parallel set of experiments, tumor growth was followed over time. Whereas F shows tumor growth over time, G presents data as the percentage of mice surviving after tumor challenge and treatment. A–D shows cumulative data from 4 different experiments (n = 3 mice per group). In E, the data are representative of 4 independent experiments (n = 3 mice per group), and F and G are representative of 3 independent experiments (n = 10 mice per group).

References

    1. Kim, J.M., J.P. Rasmussen, and A.Y. Rudensky. 2007. Regulatory T cells prevent catastrophic autoimmunity throughout the lifespan of mice. Nat. Immunol. 8:191–197. - PubMed
    1. Wan, Y.Y., and R.A. Flavell. 2007. Regulatory T-cell functions are subverted and converted owing to attenuated Foxp3 expression. Nature. 445:766–770. - PubMed
    1. Fontenot, J.D., M.A. Gavin, and A.Y. Rudensky. 2003. Foxp3 programs the development and function of CD4+CD25+ regulatory T cells. Nat. Immunol. 4:330–336. - PubMed
    1. Hori, S., T. Nomura, and S. Sakaguchi. 2003. Control of regulatory T cell development by the transcription factor Foxp3. Science. 299:1057–1061. - PubMed
    1. Mendez, S., S.K. Reckling, C.A. Piccirillo, D. Sacks, and Y. Belkaid. 2004. Role for CD4+ CD25+ regulatory T cells in reactivation of persistent leishmaniasis and control of concomitant immunity. J. Exp. Med. 200:201–210. - PMC - PubMed

Publication types

Substances