. 2008 Aug 22;4(8):e1000163.
doi: 10.1371/journal.pgen.1000163.

Deep sequencing analysis of small noncoding RNA and mRNA targets of the global post-transcriptional regulator, Hfq

Affiliations

Deep sequencing analysis of small noncoding RNA and mRNA targets of the global post-transcriptional regulator, Hfq

Alexandra Sittka et al. PLoS Genet. .

Abstract

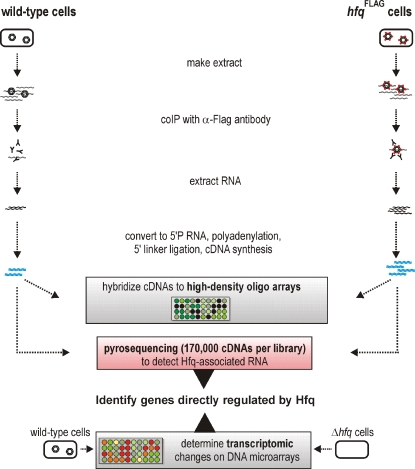
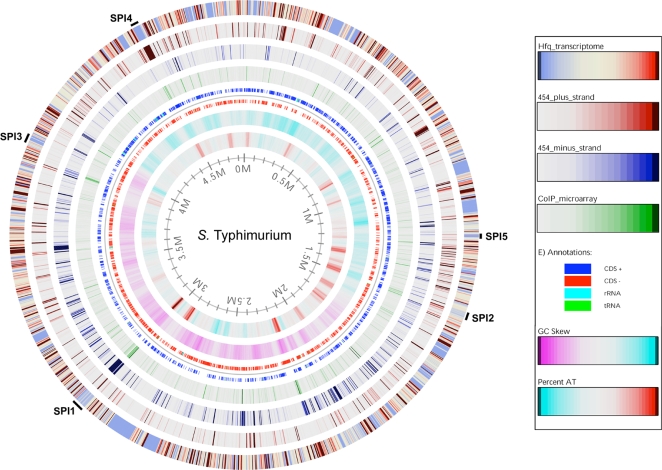
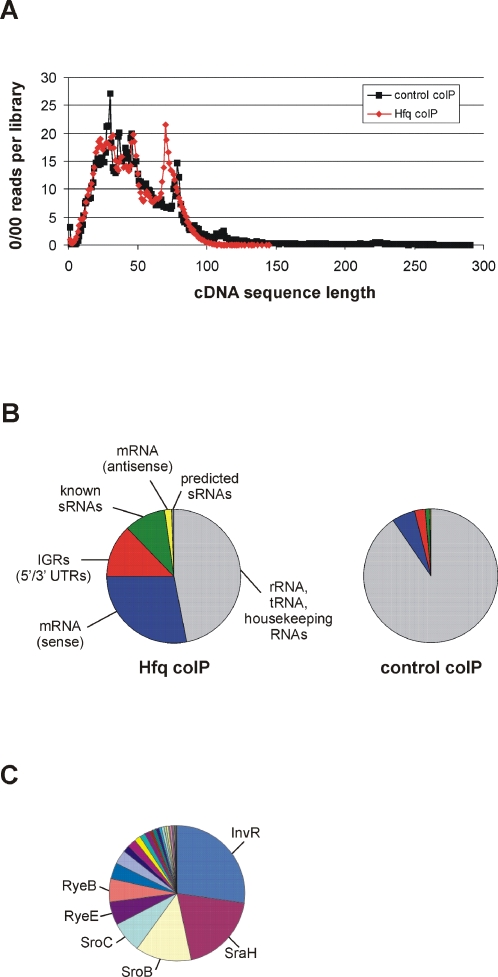
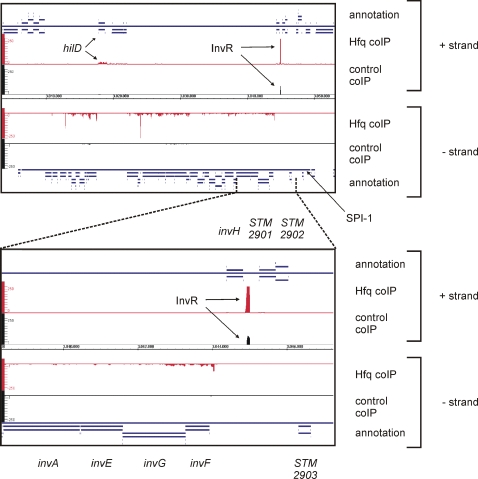
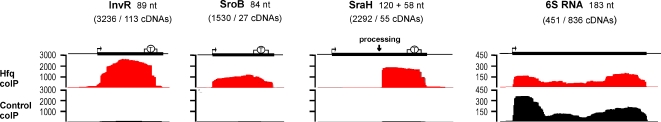
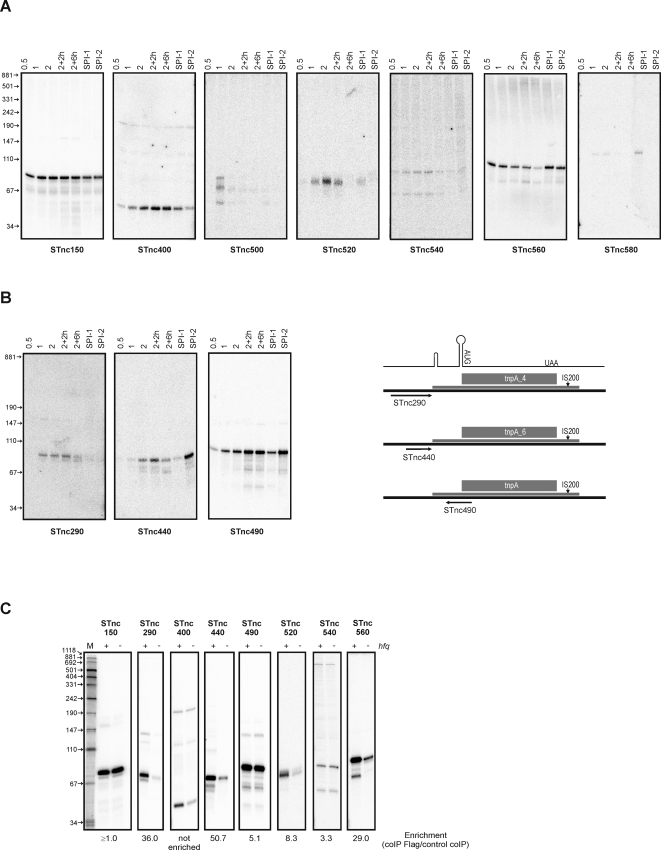
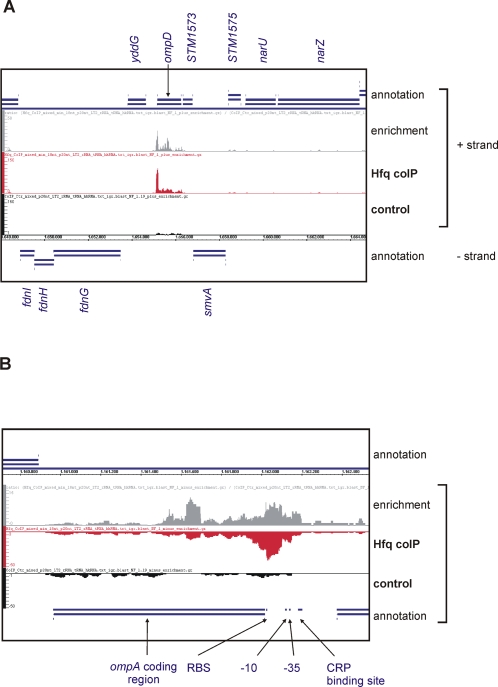
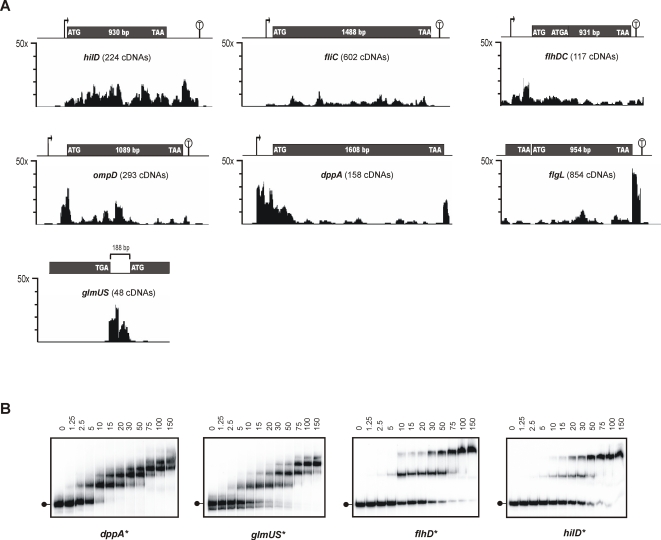
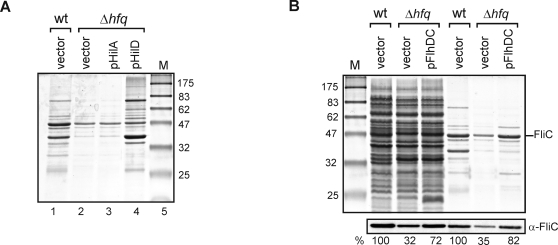
Recent advances in high-throughput pyrosequencing (HTPS) technology now allow a thorough analysis of RNA bound to cellular proteins, and, therefore, of post-transcriptional regulons. We used HTPS to discover the Salmonella RNAs that are targeted by the common bacterial Sm-like protein, Hfq. Initial transcriptomic analysis revealed that Hfq controls the expression of almost a fifth of all Salmonella genes, including several horizontally acquired pathogenicity islands (SPI-1, -2, -4, -5), two sigma factor regulons, and the flagellar gene cascade. Subsequent HTPS analysis of 350,000 cDNAs, derived from RNA co-immunoprecipitation (coIP) with epitope-tagged Hfq or control coIP, identified 727 mRNAs that are Hfq-bound in vivo. The cDNA analysis discovered new, small noncoding RNAs (sRNAs) and more than doubled the number of sRNAs known to be expressed in Salmonella to 64; about half of these are associated with Hfq. Our analysis explained aspects of the pleiotropic effects of Hfq loss-of-function. Specifically, we found that the mRNAs of hilD (master regulator of the SPI-1 invasion genes) and flhDC (flagellar master regulator) were bound by Hfq. We predicted that defective SPI-1 secretion and flagellar phenotypes of the hfq mutant would be rescued by overexpression of HilD and FlhDC, and we proved this to be correct. The combination of epitope-tagging and HTPS of immunoprecipitated RNA detected the expression of many intergenic chromosomal regions of Salmonella. Our approach overcomes the limited availability of high-density microarrays that have impeded expression-based sRNA discovery in microorganisms. We present a generic strategy that is ideal for the systems-level analysis of the post-transcriptional regulons of RNA-binding proteins and for sRNA discovery in a wide range of bacteria.


Conflict of interest statement

The authors have declared that no competing interests exist.

Figures

Figure 1
Figure 1. Strategy to identify Hfq targets.
RNA was co-immunoprecipitated with Hfq in extracts from ESP-grown Salmonella cells (wild-type and chromosomal hfq FLAG strain) using an anti-FLAG antibody. The extracted RNA was converted to 5′ monophosphate RNA, and subsequently into cDNA, followed by direct pyrosequencing. Our approach was validated by hybridization of cDNA to high density oligo microarrays. In addition, total RNA of the wild-type strain and its hfq deletion mutant was used for transcriptomic analysis using Salmonella SALSA microarrays.
Figure 2
Figure 2. Correlation between HTPS, coIP-on-chip and transcriptomic data upon the S. Typhimurium chromosome.
The data obtained from transcriptomic, cDNA sequencing and coIP-on-chip analyses of ESP-grown bacteria were mapped onto the Salmonella chromosome for direct comparison. The outer (1st) ring displays changes in gene expression in the Δhfq strain compared to the parental SL1344 strain. Genes that are down-regulated in the Δhfq strain are shown as blue; genes that are up-regulated are shown as red. The next three circles show regions coding for Hfq-associated RNA identified by deep sequencing (2nd ring shows positive strand, and 3rd ring shows negative strand) or coIP-on-chip (4th ring). Ring 5 shows the location of coding sequences on the positive strand (CDS+), on the negative strand (CDS−), and the tRNA and rRNA genes. GC-skew is shown in ring 6; purple and blue regions have a GC skew that is below or above the genomic average, respectively. AT-content is shown in ring 7; blue and red regions have an AT-content that is below or above the genomic average, respectively. Numbers on the inside of the innermost circle are the location relative to position zero measured in millions of base-pairs (Mbp) of the Salmonella LT2 genome. The location of the SPI-1 to SPI-5 is indicated. An invaluable zoomable version of this atlas is available online at http://www.cbs.dtu.dk/services/GenomeAtlas/suppl/zoomatlas/zpidStyphimurium_LT2_Atlas ; click on the region of interest to accurately visualize the data at the level of individual genes.
Figure 3
Figure 3. Statistical analysis of the cDNA sequencing results of Hfq-associated RNA.
(A) The pyrosequencing results were analyzed by plotting the number of cDNA reads over the read length in bp. The length distribution of all resulting sequences is shown. (B) Pie diagram showing the relative proportions of the different RNA species contained in all sequences that mapped to the Salmonella genome. The rRNA, tRNA and housekeeping RNAs are shown in grey. Left panel: Hfq coIP, right panel: control coIP. (C) Pie diagram showing the relative proportions of all Hfq-associated sequences that unequivocally mapped to known sRNA sequences. The names of the six most frequently recovered sRNAs are given.
Figure 4
Figure 4. Visualization of pyrosequencing data for the Salmonella pathogenicity island 1 (SPI-1) with the Integrated genome Browser (Affymetrix).
The upper panel shows an extraction of the screenshot of the Integrated Genome Browser, with the mapped Control and Hfq cDNAs of the SPI-1 region. Shown are the annotations for the “+” and “–” strand (blue), the cDNA sequence distribution from the Hfq coIP for the “+” and “–” strand (red), the cDNA-clone distribution for the control coIP for the “+” and “–” strand (black), and the genome coordinates in the center for the entire SPI-1. The annotation for SPI-1 and the Hfq coIP peaks for hilD and the sRNA InvR in the Hfq coIP are indicated. Note, that the clone numbers per nucleotide are scaled to a maximum of 250 for the Hfq and the control coIP, which truncates the high peak for InvR in the Hfq coIP library (>3000 cDNAs). The lower panel shows a close up of the invR locus and its adjacent genes.
Figure 5
Figure 5. Visualization of the clone distribution of exemplar Hfq dependent and independent sRNAs in Salmonella.
Clone distribution for sequences mapped to InvR, SroB, SraH, or 6S sRNAs (red: Hfq coIP, black: control coIP). The vertical axis indicates the number of cDNA sequences that were obtained. A bent arrow indicates each sRNA promoter, a circled “T” its transcriptional terminator.
Figure 6
Figure 6. Expression of 10 new Salmonella sRNAs over growth.
Total RNA was isolated from Salmonella at seven different growth stages and/or conditions and subjected to Northern blot analysis. (A) Blots showing the detection of stable transcripts for seven new sRNAs. The lanes refer to the following samples (from left to right): aerobic growth of the wild-type strain in L-broth to an OD600 of 0.5, 1 or 2; growth continued after the culture reached OD600 of 2 for 2 or 6 hours, respectively; SPI-1 inducing condition; SPI-2 inducing condition. (B) Northern blots of three sRNAs encoded in close proximity (STnc290, STnc440) or antisense (STnc490) to IS200 elements. A schematic presentation of the position of the sRNAs according to the IS200 element is shown to the right. The upper drawing indicates the two stem-loop structures, start codon, and stop codon of the transposase-encoding mRNA of the IS200 elements. The three detected sRNAs are indicated by black arrows. Growth conditions as Panel A. (C) RNA abundance of selected new sRNAs in wild-type (+) versus hfq mutant (−) Salmonella cells at ESP (OD600 of 2). The enrichment factor of each of these sRNAs in the coIP experiment is given below the blots for comparison.
Figure 7
Figure 7. Comparison of Hfq and Control coIP cDNA distributions at the ompD and ompA loci.
Extract of the screenshot of the Integrated Genome Browser, showing the mapped Hfq and Control cDNAs, and the enrichment curve (ratio of reads of Hfq coIP over control coIP) for (A) the ompD and (B) ompA transcripts. Shown are (from top to bottom) the annotations for the “+” strand (blue), the enrichment curve (grey), the cDNA distributions on the “+” strand for the Hfq coIP (red) and the control coIP (black), the genome coordinates, and the annotations for the “–” strand (blue). In panel A, the annotation of the ompD coding region and the flanking genes, yddG and STM1573, are indicated. For ompA, the CDS, -10 and -35 boxes, as well as the ribosome binding site (RBS) and a CRP binding site are indicated by black arrows.
Figure 8
Figure 8. Distribution patterns of cDNAs of Hfq-associated mRNA species and confirmation of binding to Hfq.
(A) Different mRNAs are shown with marked open reading frame, promoter and terminator (where known). Start and stop codons are indicated. The clone distribution is represented by a stairstep diagram of fold enrichment in Hfq coIP vs control coIP per nucleotide below each mRNA. The vertical axis indicates the enrichment factor in the Hfq coIP calculated over the control coIP. ORF length is given for each gene, for the overlapping ORFs of flhDC, or for the intergenic region in the case of glmUS mRNA. Numbers in parentheses below each gene name denote number of cDNA sequences obtained from Hfq coIP. Promoters and terminators are indicated as above. (B) The binding of Hfq to four mRNA fragments was confirmed by gel mobility shift assay. 32P-labeled RNA fragments of dppA, glmUS, flhD, or hilD, respectively, were incubated with increasing amounts of Hfq protein (concentrations of the hexamer are given in nM above the lanes). The lollipops on the left of the gel panels show the position of the unshifted mRNA fragment. Following 10 minutes incubation at 37°C, samples were resolved on native 6% polyacrylamide gels, autoradiographs of which are shown.
Figure 9
Figure 9. Rescue of complex Δhfq phenotypes by overexpression of identified Hfq target mRNAs.
SDS-PAGE analysis (12% gels stained with Coomassie) of (A) secreted proteins upon overexpression of the SPI-1 transcription factors, HilA and HilD from pCH-112 and pAS-0045 (lanes 3 and 4) in Salmonella Δhfq. Lanes 1 and 2 show the secreted protein profile of Salmonella wild-type and Δhfq bacteria carrying a control vector, pKP8-35. (B) Whole cell and secreted proteins upon overexpression of the flagellar transcription factor, FlhD2C2. The left hand three lanes show total protein samples, and the right hand three lanes show secreted proteins. Genetic background and plasmids are indicated above the lanes; FlhDC was expressed from plasmid pAS-0081. FliC was also analyzed on a Western blot using a specific antibody (lower panel). FliC protein levels are shown (in %), in comparison to wild-type Salmonella, which was set to 100% for either the total protein or secreted protein lanes.

References

    1. Majdalani N, Vanderpool CK, Gottesman S. Bacterial small RNA regulators. Crit Rev Biochem Mol Biol. 2005;40:93–113. - PubMed
    1. Vogel J, Wagner EG. Target identification of regulatory sRNAs in bacteria. Curr Opin Microbiol. 2007;10:262–270. - PubMed
    1. Storz G, Altuvia S, Wassarman KM. An abundance of RNA regulators. Annu Rev Biochem. 2005;74:199–217. - PubMed
    1. Aiba H. Mechanism of RNA silencing by Hfq-binding small RNAs. Curr Opin Microbiol. 2007;10:134–139. - PubMed
    1. Valentin-Hansen P, Eriksen M, Udesen C. The bacterial Sm-like protein Hfq: a key player in RNA transactions. Mol Microbiol. 2004;51:1525–1533. - PubMed

Publication types

MeSH terms

Associated data