

doi: 10.1002/adma.200800255.
A Comparative Study of Galvanic Replacement Reactions Involving Ag Nanocubes and AuCl(2) or AuCl(4)
Affiliations
- PMID: 18725963
- PMCID: PMC2519003
- DOI: 10.1002/adma.200800255
Item in Clipboard
A Comparative Study of Galvanic Replacement Reactions Involving Ag Nanocubes and AuCl(2) or AuCl(4)
Adv Mater.
2008.
No abstract available
Figures
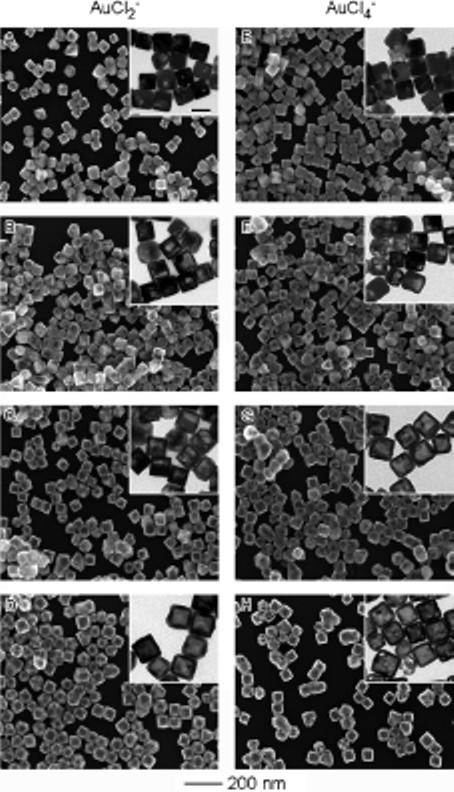
SEM and TEM (insets) images showing four different stages involved in the galvanic replacement reaction, in which Ag nanocubes were titrated with A) 1.0, B) 3.0, C) 5.0, and D) 10.0 mL of 0.1 mm AuCl2−; and E) 0.3, F) 1.0, G) 1.6, and H) 3.3 mL of 0.1 mm AuCl4−. The scale bar in the inset in (A) represents 50 nm and applies to all TEM images.
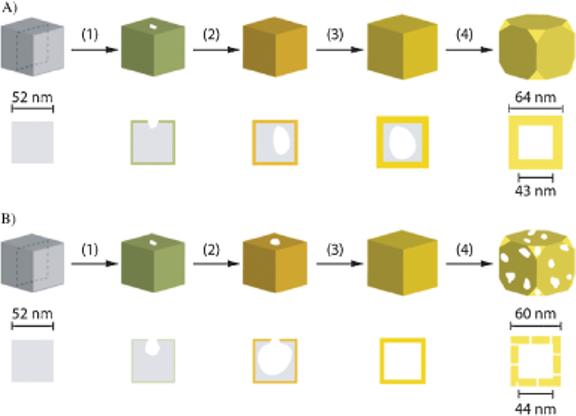
Schematic detailing the major differences in terms of morphological and structural changes during the galvanic replacement reaction involving Ag nanocubes with A) AuCl2− and B) AuCl4− in an aqueous medium. The cross-sectional view corresponds to the plane along the dashed lines.
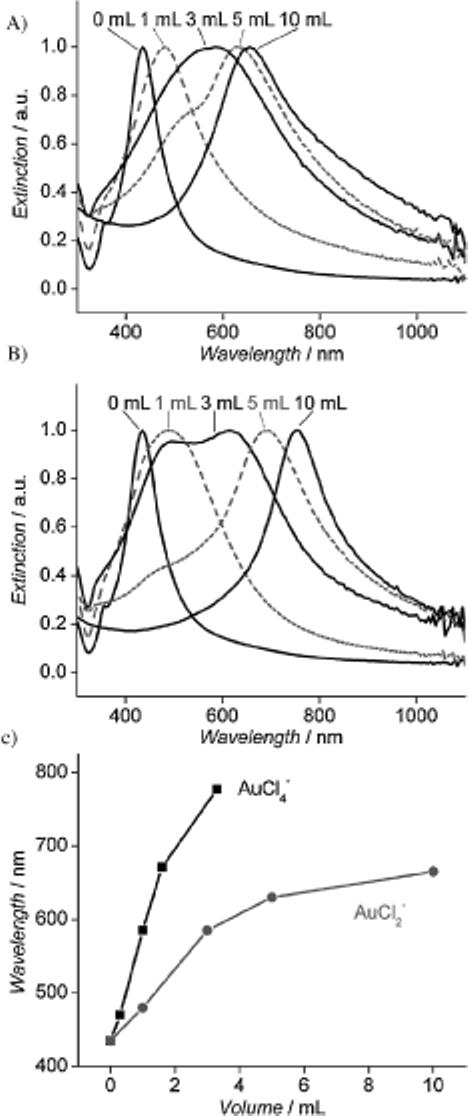
UV-vis spectra of the samples obtained by titrating Ag nanocubes with different volumes of 0.1 mm solution of A) AuCl2− and B) AuCl4−. C) Plot of the peak position versus the volume of gold precursor, suggesting that AuCl2− has a smaller shift (as seen by the more gradual ■OK?■ slope increase) compared to AuCl4− for the same volume of gold precursor added to the reaction solution.
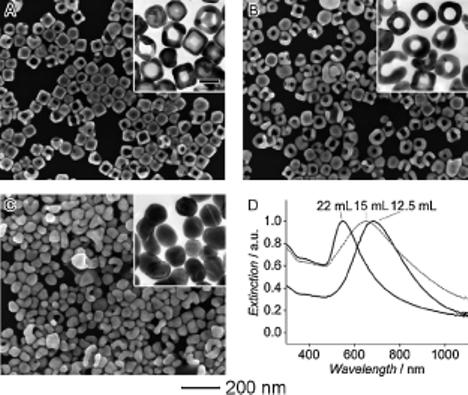
SEM and TEM (insets) images showing samples obtained in the later stages of the galvanic replacement reaction where Ag nanocubes were reacted with A) 12.5 mL, B) 15.0 mL, and (C) 22.0 mL of 0.1 mM AuCl2−. The scale bar in the inset in (A) represents 50 nm and applies to all TEM images. The corresponding UV-vis spectra of the products are shown in (D).
Similar articles
-
Enriching Silver Nanocrystals with a Second Noble Metal.Acc Chem Res. 2017 Jul 18;50(7):1774-1784. doi: 10.1021/acs.accounts.7b00216. Epub 2017 Jul 5. Acc Chem Res. 2017. PMID: 28678472
-
Real-Time Dynamics of Galvanic Replacement Reactions of Silver Nanocubes and Au Studied by Liquid-Cell Transmission Electron Microscopy.ACS Nano. 2016 Aug 23;10(8):7689-95. doi: 10.1021/acsnano.6b03020. Epub 2016 Jul 25. ACS Nano. 2016. PMID: 27389989
-
Site-Selective Carving and Co-Deposition: Transformation of Ag Nanocubes into Concave Nanocrystals Encased by Au-Ag Alloy Frames.ACS Nano. 2018 Jan 23;12(1):298-307. doi: 10.1021/acsnano.7b06353. Epub 2017 Dec 21. ACS Nano. 2018. PMID: 29257664
-
Synthesis and Optical Properties of Cubic Gold Nanoframes.Nano Res. 2008 Dec 1;1(6):441-449. doi: 10.1007/s12274-008-8046-z. Nano Res. 2008. PMID: 20200595 Free PMC article.
-
In Situ Observation of Dynamic Galvanic Replacement Reactions in Twinned Metallic Nanowires by Liquid Cell Transmission Electron Microscopy.Angew Chem Int Ed Engl. 2019 Dec 16;58(51):18627-18633. doi: 10.1002/anie.201910379. Epub 2019 Nov 4. Angew Chem Int Ed Engl. 2019. PMID: 31621994 Review.
Cited by
-
Symmetry Breaking by Surface Blocking: Synthesis of Bimorphic Silver Nanoparticles, Nanoscale Fishes and Apples.Sci Rep. 2016 Sep 8;6:32561. doi: 10.1038/srep32561. Sci Rep. 2016. PMID: 27605125 Free PMC article.
-
Detection of Silver Nanoparticles by Electrochemically Activated Galvanic Exchange.Langmuir. 2018 Dec 26;34(51):15719-15726. doi: 10.1021/acs.langmuir.8b03325. Epub 2018 Dec 11. Langmuir. 2018. PMID: 30525650 Free PMC article.
-
Plasmonic LAMP: Improving the Detection Specificity and Sensitivity for SARS-CoV-2 by Plasmonic Sensing of Isothermally Amplified Nucleic Acids.Small. 2022 Mar;18(12):e2107832. doi: 10.1002/smll.202107832. Epub 2022 Feb 7. Small. 2022. PMID: 35129304 Free PMC article.
-
Facile synthesis of branched au nanostructures by templating against a self-destructive lattice of magnetic fe nanoparticles.Angew Chem Int Ed Engl. 2008;47(50):9653-6. doi: 10.1002/anie.200804634. Angew Chem Int Ed Engl. 2008. PMID: 18988222 Free PMC article.
-
Au@Ag core-shell nanocubes with finely tuned and well-controlled sizes, shell thicknesses, and optical properties.ACS Nano. 2010 Nov 23;4(11):6725-34. doi: 10.1021/nn102237c. Epub 2010 Oct 22. ACS Nano. 2010. PMID: 20964400 Free PMC article.
References
-
- Portney NG, Ozkan M. Anal. Bioanal. Chem. 2006;384:620. - PubMed
-
- Chen J, Saeki F, Wiley BJ, Cang H, Cobb MJ, Li Z-Y, Au L, Zhang H, Kimmey MB, Li X, Xia Y. Nano Lett. 2005;5:473. - PubMed
- Chen J, Wiley BJ, Li Z-Y, Campbell D, Saeki F, Cang H, Au L, Lee J, Li X, Xia Y. Adv. Mater. 2005;17:2255.
- Cang H, Sun T, Li Z-Y, Chen J, Wiley BJ, Xia Y, Li X. Opt. Lett. 2005;30:3048. - PubMed
-
- Loo C, Lin A, Hirsch L, Lee MH, Barton J, Halas N, West J, Drezek R. Technol. Cancer Res. Treat. 2004;3:33. - PubMed
- Chen J, Wang D, Xi J, Au L, Siekkinen A, Warsen A, Li Z-Y, Zhang H, Xia Y, Li X. Nano Lett. 2007;7:1318. - PMC - PubMed
- Hirsch LR, Gobin AM, Lowery AR, Tam F, Drezek RA, Halas NJ, West JL. Ann. Biomed. Eng. 2006;34:15. - PubMed
Grants and funding
LinkOut - more resources
Full Text Sources
Other Literature Sources
