. 2008 Sep;10(3):450-4.
doi: 10.1208/s12248-008-9053-4. Epub 2008 Aug 26.

Evaluation of a scaling approach for the bioequivalence of highly variable drugs

Affiliations

Evaluation of a scaling approach for the bioequivalence of highly variable drugs

Sam H Haidar et al. AAPS J. 2008 Sep.

Erratum in

  • AAPS J. 2008 Sep;10(3):480

Abstract

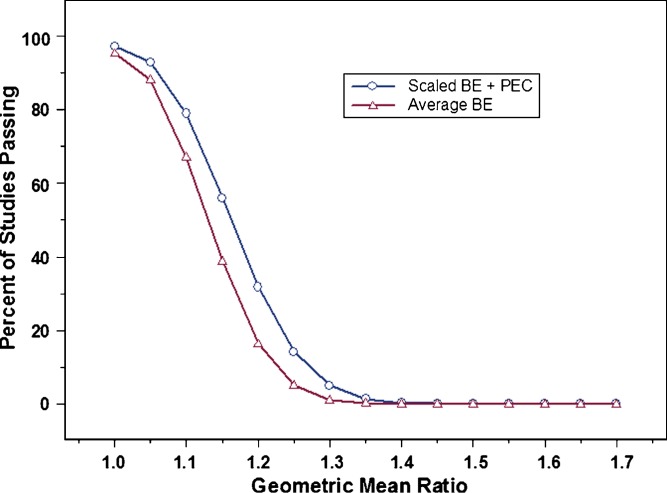
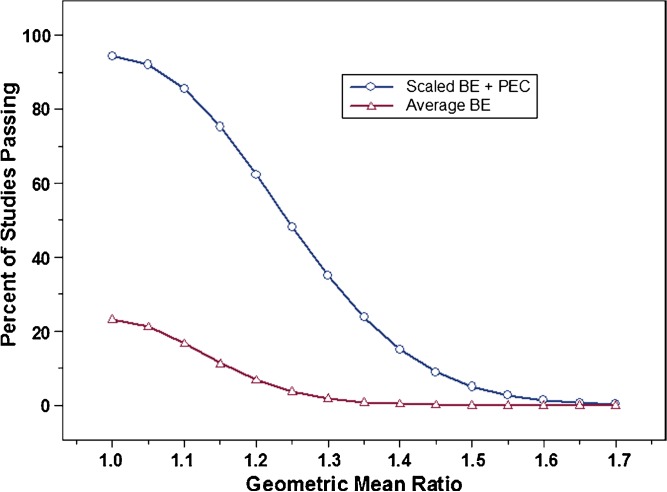
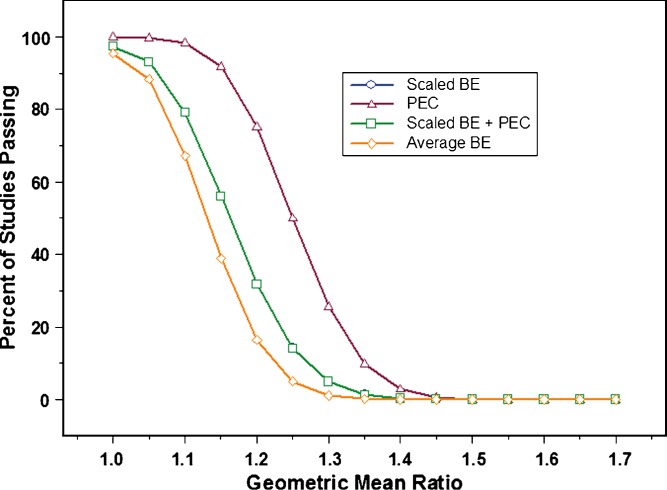
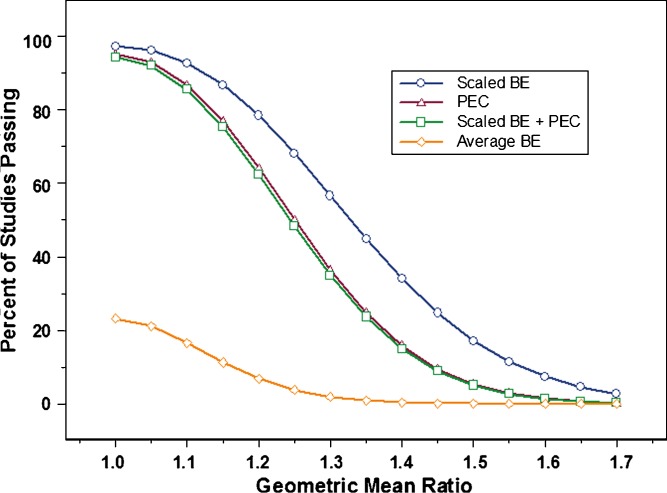
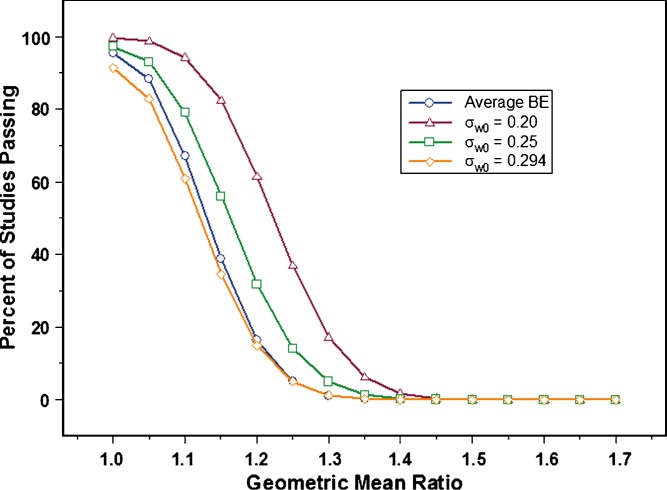
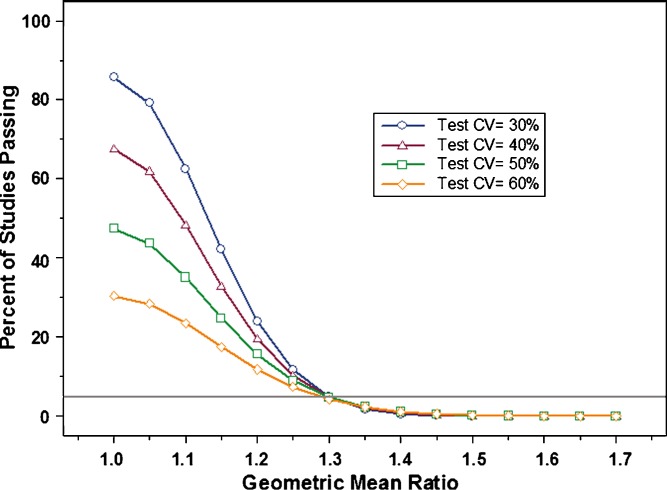
Various approaches for evaluating the bioequivalence (BE) of highly variable drugs (CV > or = 30%) have been debated for many years. More recently, the FDA conducted research to evaluate one such approach: scaled average BE. A main objective of this study was to determine the impact of scaled average BE on study power, and compare it to the method commonly applied currently (average BE). Three-sequence, three period, two treatment partially replicated cross-over BE studies were simulated in S-Plus. Average BE criteria, using 80-125% limits on the 90% confidence intervals for C (max) and AUC geometric mean ratios, as well as scaled average BE were applied to the results. The percent of studies passing BE was determined under different conditions. Variables tested included within subject variability, point estimate constraint, and different values for sigma(w0), which is a constant set by the regulatory agency. The simulation results demonstrated higher study power with scaled average BE, compared to average BE, as within subject variability increased. At 60% CV, study power was more than 90% for scaled average BE, compared with about 22% for average BE. A sigma(w0) value of 0.25 appears to work best. The results of this research project suggest that scaled average BE, using a partial replicate design, is a good approach for the evaluation of BE of highly variable drugs.


Figures

Fig. 1
Fig. 1
Percent of studies passing bioequivalence (BE) (power curves); average BE (open triangle) vs. scaled average BE (open circle), with a point estimate constraint, at 30% CV (test and reference), N = 36, and σ w0 = 0.25. Results shown represent one million simulations
Fig. 2
Fig. 2
Percent of studies passing for average BE (open triangle) vs. scaled average BE (open circle), with a point estimate constraint, at 60% CV (test and reference), N = 36, and σ w0 = 0.25. Results shown represent one million simulations
Fig. 3
Fig. 3
Power curves for average BE (open diamond); scaled average BE with point estimate constraint (PEC)(open square); PEC (open triangle); and scaled average BE without PEC (open circle). The experimental conditions were as follows: 30% CV (test and reference), N = 36, and σ w0 = 0.25. Results shown represent one million simulations. Please note that the plot for scaled average BE does not appear on the graph because it completely overlaps with the plot for scaled average BE with point estimate constraint, indicating no impact of constraining the point estimate at this level of within subject variability
Fig. 4
Fig. 4
Power curves for average BE (open diamond); scaled average BE with PEC(open square); PEC (open triangle); and scaled average BE without PEC (open circle). The experimental conditions were as follows: 60% CV (test and reference), N = 36, and σ w0 = 0.25. Results shown represent one million simulations
Fig. 5
Fig. 5
Power curves showing average BE (open circle), and different values for σ w0. The experimental conditions were as follows: 30% CV (test and reference), N = 36, and σ w0 = 0.20 (open triangle), 0.25 (open square), and 0.294 (open diamond). Results shown represent one million simulations
Fig. 6
Fig. 6
This graph illustrates the impact on study power of increasing within subject variability in the test product, while keeping variability of the reference constant (30% CV). Variability (%CV) in the test product evaluated was: 30% (open circle), 40% (open triangle), 50% (open square), 60% (open diamond)

References

    1. U.S. Food and Drug Administration. Guidance for Industry: Bioavailability and Bioequivalence Studies for Orally Administered Drug Products—General Considerations, March 2003.
    1. Sheiner L. B. Bioequivalence Revisited. Stat. Med. 1992;11:1777–1788. doi: 10.1002/sim.4780111311. - DOI - PubMed
    1. Schall R., Luus H. G. On Population and Individual Bioequivalence. Stat. Med. 1993;12:1109–1124. - PubMed
    1. Haidar S. H., Davit B., Chen M-L., Conner D., Lee L. M., Li Q. H., Lionberger R., Makhlouf F., Patel D., Schuirmann D. J., Yu L. X. Bioequivalence approaches for highly variable drugs and drug products. Pharm. Res. 2008;25:237–241. doi: 10.1007/s11095-007-9434-x. - DOI - PubMed
    1. Patterson S. D., Zariffa N. M.-D., Montague T. H., Howland K. Non-traditional study designs to demonstrate average bioequivalence for highly variable drug products. Eur. J. Pharm. Sci. 2001;57:663–670. doi: 10.1007/s002280100371. - DOI - PubMed

MeSH terms

Substances