. 2008 Oct 24;283(43):29461-72.
doi: 10.1074/jbc.M804103200. Epub 2008 Aug 26.

Small molecules can selectively inhibit ephrin binding to the EphA4 and EphA2 receptors

Affiliations

Small molecules can selectively inhibit ephrin binding to the EphA4 and EphA2 receptors

Roberta Noberini et al. J Biol Chem. .

Abstract

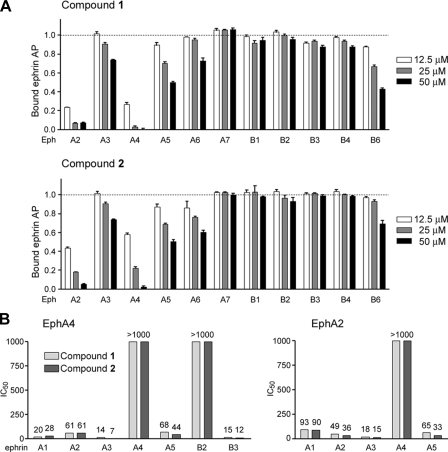
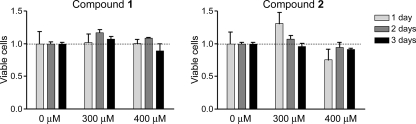
The erythropoietin-producing hepatocellular (Eph) family of receptor tyrosine kinases regulates a multitude of physiological and pathological processes. Despite the numerous possible research and therapeutic applications of agents capable of modulating Eph receptor function, no small molecule inhibitors targeting the extracellular domain of these receptors have been identified. We have performed a high throughput screen to search for small molecules that inhibit ligand binding to the extracellular domain of the EphA4 receptor. This yielded a 2,5-dimethylpyrrolyl benzoic acid derivative able to inhibit the interaction of EphA4 with a peptide ligand as well as the natural ephrin ligands. Evaluation of a series of analogs identified an isomer with similar inhibitory properties and other less potent compounds. The two isomeric compounds act as competitive inhibitors, suggesting that they target the high affinity ligand-binding pocket of EphA4 and inhibit ephrin-A5 binding to EphA4 with K(i) values of 7 and 9 mum in enzyme-linked immunosorbent assays. Interestingly, despite the ability of each ephrin ligand to promiscuously bind many Eph receptors, the two compounds selectively target EphA4 and the closely related EphA2 receptor. The compounds also inhibit ephrin-induced phosphorylation of EphA4 and EphA2 in cells, without affecting cell viability or the phosphorylation of other receptor tyrosine kinases. Furthermore, the compounds inhibit EphA4-mediated growth cone collapse in retinal explants and EphA2-dependent retraction of the cell periphery in prostate cancer cells. These data demonstrate that the Eph receptor-ephrin interface can be targeted by inhibitory small molecules and suggest that the two compounds identified will be useful to discriminate the activities of EphA4 and EphA2 from those of other co-expressed Eph receptors that are activated by the same ephrin ligands. Furthermore, the newly identified inhibitors represent possible leads for the development of therapies to treat pathologies in which EphA4 and EphA2 are involved, including nerve injuries and cancer.


Figures

FIGURE 1.
FIGURE 1.
High throughput screening identifies small molecules that inhibit EphA4 ligand binding. A, results from the screen showing the ELISA plate from which compound 1 was identified. Orange, well containing compound 1; yellow, wells containing compounds from the library that are not inhibitory; red, control wells containing EphA4 AP; blue, control wells containing AP; and white, control wells containing only buffer. B, 2,5-dimethylpyrrolyl benzene derivatives identified in the high throughput screening for EphA4 inhibitors; the names of the compounds, indicated at the left of the structures, correspond to those in Fig. 4. The first value in the % inhibition (% Inhib.) column was obtained in the original screen with 10 μg/ml compound; the second value was obtained in a confirmatory repeat of the experiment. IC50 values were calculated by measuring binding of EphA4 AP to immobilized KYL peptide or ephrin-A5 AP to immobilized EphA4 Fc in the presence of different concentrations of the compounds.
FIGURE 2.
FIGURE 2.
Small molecules identified by high throughput screening inhibit ephrin-A5 binding to EphA4 in a competitive manner. Compound 1 and compound 2 inhibit EphA4 AP binding to immobilized biotinylated KYL peptide and ephrin-A5 AP binding to immobilized EphA4 ectodomain fused to Fc in a concentration-dependent manner, as shown in the two top panels for each compound. The bottom left panels show the binding of ephrin-A5 AP to immobilized EphA4 Fc in the presence of different concentrations of each compound as follows: (•), 0 μm;(○), 10 μm; (▪), 20 μm;(□), 30 μm;(▴), 40 μm;(Δ), 50 μm. These curves were used to calculate the dissociation constants (KD) and maximal binding (Bmax) used in the bottom right panels to determine Ki values. Error bars represent standard errors from triplicate measurements.
FIGURE 3.
FIGURE 3.
Compounds 1 and 2 are selective in their inhibition of Eph receptor-ephrin interactions. A, ephrin-A5 AP binding to immobilized EphA receptor Fc fusion proteins and ephrin-B2 AP binding to immobilized EphB receptor Fc fusion proteins were measured in the presence of the indicated concentrations of compounds 1 and 2. The histogram shows the ratio of ephrin AP bound in the presence and in the absence of the compounds. Error bars represent standard errors from triplicate measurements. B, IC50 values for inhibition of EphA4 AP and EphA2 AP binding to the indicated immobilized ephrins by compounds 1 and 2.
FIGURE 4.
FIGURE 4.
Structure-activity relationship analysis of small molecules related to compounds 1 and 2. Structures of some 2,5-dimethylpyrrolylbenzoic acid derivatives that were examined and their IC50 values (μm) for inhibition of EphA4 AP binding to the KYL peptide and ephrin-A5 AP binding to EphA4 Fc. Standard errors are indicated for IC50 values obtained from multiple experiments. The compounds are arranged in order of decreasing potency for inhibition of EphA4-ephrin-A5 binding or EphA4-KYL binding. Only compounds 1-4 were able to detectably inhibit EphA4-ephrin-A5 binding; n.d. indicates that inhibitory effects were not detectable. Additional compounds that were examined are shown in supplemental Fig. 1.
FIGURE 5.
FIGURE 5.
Compounds 1 and 2 inhibit ephrin-induced tyrosine phosphorylation of EphA4 and EphA2. A, HT22 neuronal cells pretreated with the indicated concentrations of compounds 1 or 2 for 15 min were stimulated with 0.5 μg/ml ephrin-A5 Fc (+) or Fc as a control (-) for 20 min in the continued presence of the compounds. EphA4 immunoprecipitates were probed with anti-phosphotyrosine antibody (PTyr) and reprobed for EphA4. C indicates immunoprecipitations (IP) performed with control antibodies from nonimmunized rabbits. B, histogram shows the levels of EphA4 phosphorylation quantified from immunoblots and normalized to the amount of immunoprecipitated EphA4. Error bars represent standard errors from four experiments for compound 1 and three experiments for compound 2. Receptor phosphorylation levels were compared with those in ephrin-stimulated cells in the absence of compounds by one-way ANOVA and Dunnett's post test. *, p < 0.05; **, p < 0.01. C, COS7 cells pretreated with the indicated concentrations of compounds 1 or 2 for 15 min were stimulated with 0.1 μg/ml ephrin-A1 Fc or Fc in the continued presence of the compounds. EphA2 immunoprecipitates were probed with anti-phosphotyrosine antibody (PTyr) and reprobed for EphA2. C indicates control immunoprecipitations. D, histogram shows the levels of EphA2 phosphorylation quantified from immunoblots and normalized to the amount of immunoprecipitated EphA2. Error bars represent standard errors from two experiments, including some duplicate samples. Statistical analyses were performed as in B. E, HUVE cells were left unstimulated or stimulated with TNFα for 2 h in the presence of 400 μm compound 1. Duplicate samples are shown for cells not treated with compound 1. C indicates control immunoprecipitations. EphA2 immunoprecipitates were probed with anti-phosphotyrosine antibody (PTyr) and reprobed for EphA2. F, histogram shows the levels of EphA2 phosphorylation quantified from immunoblots and normalized to the amount of immunoprecipitated EphA2. Error bars represent standard errors from three experiments. Receptor phosphorylation levels in cells treated with compound 1 were compared with those in nontreated samples by nonpaired Student's t test. *, p < 0.05; ***, p < 0.001. G, the same protocol described in C was used, except that COS7 cells were stimulated with 0.5 μg/ml ephrin-B2 Fc, and the EphB2 receptor was immunoprecipitated. H, COS7 cells pretreated with the indicated concentrations of compounds 1 or 2 were stimulated with EGF (+) or left unstimulated (-). Lysates were probed with anti-phosphotyrosine antibody (PTyr) and reprobed for the EGF receptor.
FIGURE 6.
FIGURE 6.
Compounds 1 and 2 do not have toxic effects in cell culture. HT22 neuronal cells were grown in the presence of the indicated concentrations of compounds 1 and 2 for 1-3 days. Only DMSO was used in the “0 μm” sample, as a control. After addition of MTT, absorbance was measured at 570 nm to determine the levels of viable cells present. The histograms show the absorbance obtained for each condition normalized to the absorbance in the absence of the compounds. Error bars represent standard errors from triplicate measurements.
FIGURE 7.
FIGURE 7.
Compounds 1 and 2 block EphA4-dependent growth cone collapse in retinal neurons. A, explants from embryonic day 6 chicken embryonic retina were preincubated with 5 μm KYL peptide for 15 min, stimulated for 30 min with 1 μg/ml ephrin-A5 Fc or Fc as a control in the continued presence of the peptide, and stained with rhodamine-phalloidin to label filamentous actin. B, histogram showing the mean percentages of collapsed growth cones. Growth cones were scored as collapsed when no lamellipodia or filopodia were visible at the tip of the neurites. In each experiment, 30-200 growth cones per condition were scored, and error bars represent standard errors from three experiments. C-F, experiments were performed as in A, except that retinal explants were treated with 400 μm compound 1 (C and D) or compound 2 (E and F). In each experiment, 80-250 growth cones per condition were scored, and error bars represent standard errors from three experiments. Collapsed growth cones under different conditions were compared with those in the corresponding Fc control condition by one-way ANOVA and Dunnett's post test. *, p < 0.05; **, p < 0.01. Scale bar in A = 25 μm.
FIGURE 8.
FIGURE 8.
Compounds 1 and 2 inhibit EphA2-dependent retraction and rounding of PC3 prostate cancer cells. A, PC3 cells pretreated for 15 min with the indicated concentrations of compounds 1 or 2 were stimulated with 0.5 μg/ml ephrin-A1 Fc (+) or Fc as a control (-) for 20 min in the continued presence of the compounds. EphA2 immunoprecipitates (IP) were probed with anti-phosphotyrosine antibody (PTyr) and reprobed for EphA2. C indicates immunoprecipitations performed with control antibodies. B, histogram showing the levels of EphA2 phosphorylation normalized to the amount of immunoprecipitated EphA2. Error bars represent standard errors from three experiments. Receptor phosphorylation levels were compared with those in the ephrin-stimulated cells in the absence of compounds by one-way ANOVA and Dunnett's post test. C, PC3 cells stimulated with compound 1 as in A were stained with rhodaminephalloidin to label actin filaments (red) and 4′,6-diamidino-2-phenylindole (DAPI) to label nuclei (blue). DMSO was used as a control (0 μm). D, histogram showing the average area of the cells normalized to the value obtained for the Fc-treated cells. E, histogram showing the average percentage of retracting cells. Cells having rounded shape and area less than 20% of the mean value obtained for the Fc-stimulated cells were scored as retracting. Error bars in D and E represent standard errors from three experiments. F-H, same experiments and analyses as in C-E were performed using compound 2. The areas occupied by the cells and the percentage of cell retraction under different conditions were compared with those in the Fc control condition by one-way ANOVA and Dunnett's post test. *, p < 0.05; **, p < 0.01. Scale bars in C and F = 50 μm.

References

    1. Adams, R. H. (2002) Semin. Cell Dev. Biol. 13 55-60 - PubMed
    1. Pasquale, E. B. (2005) Nat. Rev. Mol. Cell Biol. 6 462-475 - PubMed
    1. Egea, J., and Klein, R. (2007) Trends Cell Biol. 17 230-238 - PubMed
    1. Luo, L., and Flanagan, J. G. (2007) Neuron 56 284-300 - PubMed
    1. Du, J., Fu, C., and Sretavan, D. W. (2007) Curr. Pharm. Des. 13 2507-2518 - PubMed

Publication types