. 2008 Sep 2;105(35):13139-44.
doi: 10.1073/pnas.0806133105. Epub 2008 Aug 26.

NGF and BDNF signaling control amyloidogenic route and Abeta production in hippocampal neurons

Affiliations

NGF and BDNF signaling control amyloidogenic route and Abeta production in hippocampal neurons

Carmela Matrone et al. Proc Natl Acad Sci U S A. .

Abstract

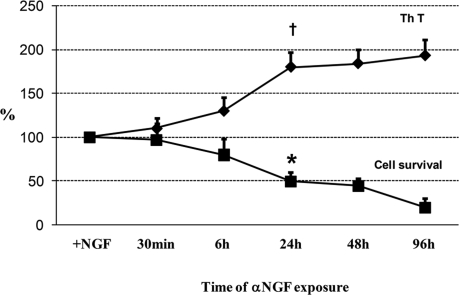
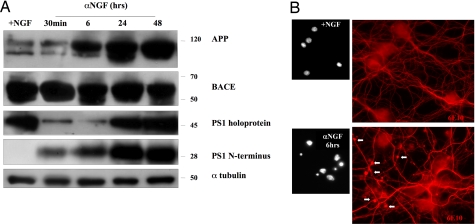
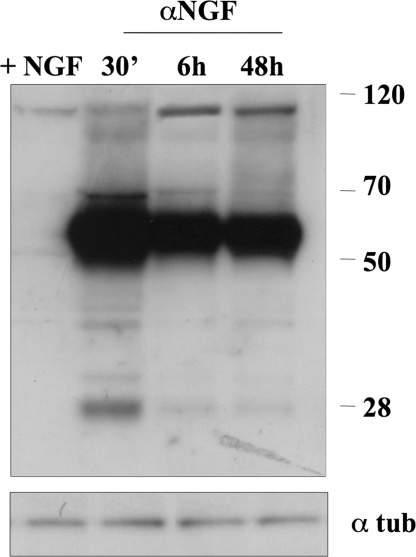
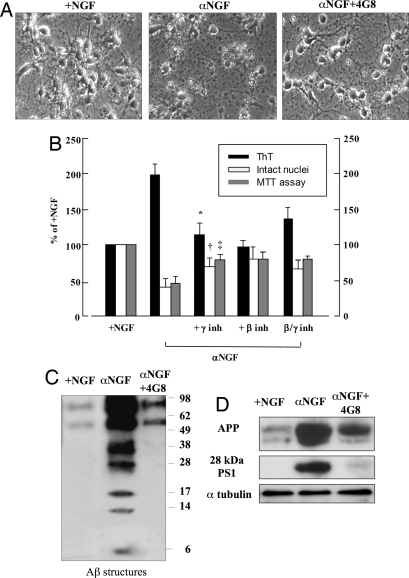
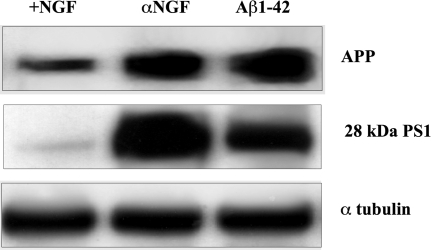
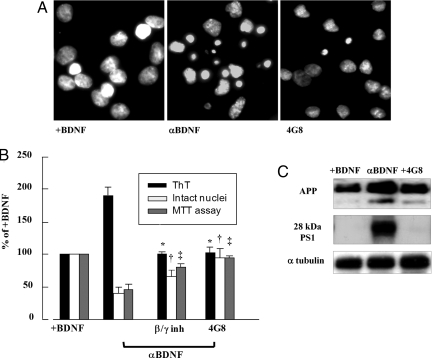
Here, we report that interruption of NGF or BDNF signaling in hippocampal neurons rapidly activates the amyloidogenic pathway and causes neuronal apoptotic death. These events are associated with an early intracellular accumulation of PS1 N-terminal catalytic subunits and of APP C-terminal fragments and a progressive accumulation of intra- and extracellular Abeta aggregates partly released into the culture medium. The released pool of Abeta induces an increase of APP and PS1 holoprotein levels, creating a feed-forward toxic loop that might also cause the death of healthy neurons. These events are mimicked by exogenously added Abeta and are prevented by exposure to beta- and gamma-secretase inhibitors and by antibodies directed against Abeta peptides. The same cultured neurons deprived of serum die, but APP and PS1 overexpression does not occur, Abeta production is undetectable, and cell death is not inhibited by anti-Abeta antibodies, suggesting that hippocampal amyloidogenesis is not a simple consequence of an apoptotic trigger but is due to interruption of neurotrophic signaling.


Conflict of interest statement

The authors declare no conflict of interest.

Figures

Fig. 1.
Fig. 1.
The effect of NGF deprivation on cell survival and ThT binding protein release in hippocampal neurons. Neurons cultured for 3–4 days were exposed to NGF (50 ng/ml) for 48 h and then deprived of the same neurotrophin by rinsing the medium, washing three times and adding anti-NGF antibody (MAb anti-NGF, 30 μg/ml) for a time ranging from 30 min to 96 h. Cell viability was evaluated by counting intact nuclei. See also Table 1.
Fig. 2.
Fig. 2.
The interruption of NGF signal activates amyloidogenesis. (A) Western blot analysis performed with antibodies against APP, BACE, and PS1 (see Methods) of lysates from hippocampal neurons of controls (+NGF) or of neurons exposed to anti-NGF antibodies (αNGF) in a time ranging from 30 min to 48 h. See Table 2 for the corresponding optical density analysis. (B) (Right) Immunofluorescence analysis performed with anti-Aβ antibody against amino acid residues 1–17 (MAb 6E10). Arrows mark varicosities forming along neurites after 6 h of NGF removal. (Left) Hoechst staining of nuclei.
Fig. 3.
Fig. 3.
Western blot analysis performed with APP C-terminal antibody of lysates from hippocampal neurons of controls (+NGF) or of neurons exposed to anti-NGF antibodies (αNGF) in a time ranging from 30 min to 48 h.
Fig. 4.
Fig. 4.
The exposure to secretase inhibitors or to antiamyloid antibody prevents amyloidogenesis and protects neurons from death. (A) Micrographs of phase-contrast microscopy of hippocampal neurons after 48 h of anti-NGF antibody exposure (αNGF) in the presence (αNGF+4G8) or absence of anti-Aβ antibody, MAb 4G8. See also Table 3. (B) ThT-binding protein assay (black bars), the number of intact nuclei (white bars) and the MTT analysis (gray bars) of hippocampal neurons incubated with anti-NGF antibodies alone (αNGF, 30 μg/ml) or in the presence of β- (250 ng/ml) or γ- (50 ng/ml) secretase inhibitors for 48 h. Each data point is the mean ± SE of triplicate determinations of 12 independent experiments and is expressed as the percentage of control values (+NGF). *, P < 0.05 versus ThT values; †, P < 0.05 versus intact nuclei values; ‡, P < 0.05 versus MTT values of anti-NGF samples (αNGF). (C and D) Western blot analysis performed with anti-Aβ antibody (MAb 4G8), anti-APP N-terminal residues (MAb 22C11), and anti-PS1 N-terminal domain (see Methods) of whole cellular lysates from hippocampal neurons exposed to anti-NGF antibody for 48 h (αNGF) with or without MAb 4G8, (αNGF+ 4G8). After stripping, the same PVDF membranes were incubated with a MAb against α-tubulin as a control of protein loading. See Table 4 for corresponding optical density values.
Fig. 5.
Fig. 5.
Western blot analysis of whole lysates from hippocampal neurons of controls (+NGF) or incubated with anti-NGF antibodies (αNGF, 30 μg/ml) or with Aβ 1-42 (Aβ 1-42, 20 μM) for 48 h. The corresponding optical density analysis is shown in Table 5.
Fig. 6.
Fig. 6.
Serum deprivation induces neuronal death which is not associated to activation of amyloidogenic pathway. (A) Western blot analysis of APP and PS1 N-terminal levels from whole lysates from hippocampal neurons cultured in the presence of serum for 6–7 days or deprived of serum and incubated with or without anti-Aβ antibody (4G8, 1 μg/ml) for 48 h. All values reported in the corresponding Table 6 are expressed as percentage of control values (+serum) and normalized on the basis of α-tubulin values. Data represent the mean ± SE (bars) of four independent experiments. (B) ThT and cell death analysis assessed by counting intact nuclei from neurons deprived of serum (−serum) in the presence or absence of anti-Aβ antibodies (+4G8) or with Actinomicin D (Act D, 1 μg/ml). Each data point is the mean ± SE of triplicate determinations of four independent experiments and is expressed as percentage of control values (+serum). *, P < 0.05 versus intact nuclei values of samples incubated with serum; †, P < 0.05 versus intact nuclei values of samples incubated with actinomicin D.
Fig. 7.
Fig. 7.
BDNF deprivation activates amyloidogenesis. (A) Micrographs of Hoechst 33258-stained hippocampal neurons 48 h after incubation with antibodies against BDNF(αBDNF) in the presence or absence of anti-Aβ antibody, MAb 4G8 (4G8). (B) The histograms report the ThT-binding protein analysis (black bars), the evaluation of intact nuclei (white bars), and the MTT analysis (gray bars). Each data point is the mean ± SE of triplicate determinations of eight independent experiments and is expressed as percentage of control values (+BDNF). *, P < 0.05 versus ThT values; †, P < 0.05 versus intact nuclei values; ‡, P < 0.05 versus MTT values of samples incubated with anti-BDNF antibody (αBDNF). (C) Western blot analysis of APP and 28-kDa N-terminal PS1 fragment of hippocampal neurons exposed for 48 h to BDNF and subsequently incubated with an anti-BDNF antibody (αBDNF) in the presence or absence of anti-Aβ antibody MAb 4G8. See Table 7 for the corresponding optical density.

References

    1. Allen SJ, Dawbarn D. Clinical relevance of neurotrophins and their receptors. Clin Sci (London) 2006;110:175–191. - PubMed
    1. Williams BJ, Eriksdotter-Jonhagen M, Granholm AC. Nerve growth factor in treatment and pathogenesis of Alzheimer disease. Prog Neurobiol. 2006;80:114–128. - PubMed
    1. Arancio O, Chao MV. Neurotrophins, synaptic plasticity and dementia. Curr Opin Neurobiol. 2007;17:325–330. - PubMed
    1. Tuszynski MH, et al. A phase 1 clinical trial of nerve growth factor gene therapy for Alzheimer disease. Nat Med. 2005;11:551–555. - PubMed
    1. Frielingsdorf H, Simpson DR, Thal LJ, Pizzo DP. Nerve growth factor promotes survival of new neurons in the adult hippocampus. Neurobiol Dis. 2007;26:47–55. - PubMed

Publication types

MeSH terms

LinkOut - more resources