. 2008 Oct 15;105(3):885-95.
doi: 10.1002/jcb.21888.

Activating transcription factor 4 is critical for proliferation and survival in primary bone marrow stromal cells and calvarial osteoblasts

Affiliations

Activating transcription factor 4 is critical for proliferation and survival in primary bone marrow stromal cells and calvarial osteoblasts

Xiaoyan Zhang et al. J Cell Biochem. .

Abstract

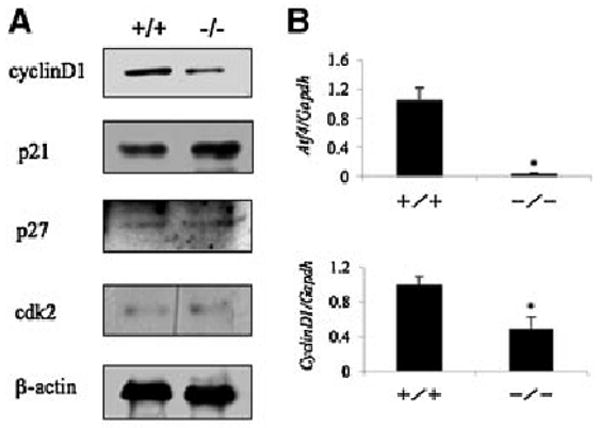
Activating transcription factor 4 (ATF4) is essential for bone formation. However, the mechanism of its actions in bone is poorly understood. The present study examined the role for ATF4 in the regulation of proliferation and survival of primary mouse bone marrow stromal cells (BMSCs) and osteoblasts. Results showed that Atf4(-/-) cells display a severe proliferative defect as measured by multiple cell proliferation assays. Cell cycle progression of Atf4(-/-) BMSCs was largely delayed with significant G1 arrest. Expression of cyclin D1 was decreased both at the mRNA and protein level. A similar proliferation defect was observed in Atf4(-/-) calvarial periosteal osteoblasts when compared with wt control. Knocking down Atf4 mRNA by small interfering RNA in MC3T3-E1 subclone 4 preosteoblasts markedly reduced expression of cyclin D1 and cell proliferation. In contrast, overexpression of ATF4 increased cyclin D1 expression as well as cell proliferation in Atf4(-/-) BMSCs. In addition, apoptosis was significantly increased in Atf4(-/-) BMSCs and calvarial periosteal osteoblasts relative to wt controls. Taken together, these results for the first time demonstrate that ATF4 is a critical regulator of proliferation and survival in BMSCs and osteoblasts in vitro and in vivo.


Figures

Fig. 1
Fig. 1
ATF4 is required for primary BMSC proliferation. A: Total nucleated bone marrow cells. Long bones (two femurs and two tibias) from 6-week-old male wt and Atf4−/− mice (6 mice per group) were isolated. Bone marrow was flushed out and red blood cells (RBC) were lysed using the RBC lysis buffer. Total nucleated bone marrow cells were counted using a hemacytometer. B: Colony numbers in bone marrow. After lysing the RBCs, the remaining total nucleated bone marrow cells from each mouse (two femurs and two tibias, 6 mice/group) were diluted (1:2,000) and cultured in proliferation medium. 24 h later, the non-adhering cells were removed by washing the cells 3 times with 1× PBS. Cells were then cultured in proliferation medium for 10 days. The numbers of colonies were then counted using a microscope. C: MTS assay. Wt and Atf4−/− BMSCs were seeded at a density of 104 cells/well in 96-well plate and cultured in proliferation medium for 0, 2, 4, 6, and 8 days followed by incubation with 20 μl of CellTitre96AQ solution reagent for 2 h. The absorbance was recorded at 490 nm using a 96-well plate reader. D: [3H] thymidine incorporation. wt and Atf4−/− BMSCs were plated in 12-well plates at 5 × 10⁴ cells/well in proliferation medium for 24 h and switched to 0.1% FBS alpha-MEM for 24 h and [3H] thymidine was then added to the culture (proliferation medium) to a final concentration of 5 μCi/ml and incubated at 37°C for 1 h. *P<0.05 (wt vs. Atf4−/−), Data represent mean ±SD. Experiments were repeated 3 times and qualitatively identical results were obtained.
Fig. 2
Fig. 2
ATF4 is required for proliferation of calvarial periosteal osteoblasts in vivo. Six-week-old male wt (A) and Atf4−/− (B) mice (6 mice per group) were injected intraperitoneally with 100 μg bromodeoxyuridine (BrdU)/12 μg fluorodeoxyuridine (FdU) per gram of body weight 4 h before sacrifice. After sacrifice, sections of calvariae were obtained. C: BrdU positive cells on the periosteal surface of calvariae were counted and normalized to the total cells from the same area. *P<0.05 (wt vs. Atf4−/−). Data represent mean±SD. Arrows indicate BrdU-positive (proliferating) cells and Δ indicates BrdU-negative (nonproliferating) cells. [Color figure can be viewed in the online issue, which is available at www.interscience.wiley.com.]
Fig. 3
Fig. 3
ATF4 deficiency attenuates cell cycle progression. 5 × 10⁵ wt (A, top) and Atf4−/− (A, bottom) BMSCs were suspended in 1.0 ml proliferation medium and labeled using the Vybrant DyeCycle Violet Stain Kit according to the manufacturer's instruction (Invitrogen). Cell population of different cell cycle phases was then measured by flow cytometry using 405 nm excitation and 440 nm emission. Quantitative data are presented in panel B. *P< 0.05 (wt vs. Atf4−/−). Data represent mean ±SD. Experiments were repeated 3 times and qualitatively identical results were obtained. P2, P3, and P4 represent cell population of G1, S and G2/M phases, respectively. It should be noted that scales are different from +/+ and −/−. [Color figure can be viewed in the online issue, which is available at www.interscience.wiley.com.]
Fig. 4
Fig. 4
ATF4 deficiency decreases cyclins D1 expression in primary BMSCs. A: Western blot analysis. wt and Atf4−/− BMSCs were seeded at a density of 5 × 10⁴ cells/cm2 in 35-mm dish and cultured in proliferation medium for 4 days. Whole cell extracts were used for Western blot analysis for cyclin D1, p21, p27,CDK2,and beta-actin (for loading). B: Quantitative real-time RT/PCR. wt and Atf4−/− BMSCs were treated as in (A) and harvested for RNA isolation and quantitative real-time RT/PCR analysis for cyclin D1 and Atf4 mRNAs that were normalized to Gapdh mRNA. *P< 0.05 (wt vs. Atf4−/−). Experiments were repeated 3 times and qualitatively identical results were obtained.
Fig. 5
Fig. 5
ATF4 siRNA blocks endogenous cyclin D1 expression and inhibits cell proliferation in MC-4 Cells. A–C: Quantitative real-time RT/PCR. MC-4 cells were seeded at a density of 5 × 10⁴ cells/cm2 in 35-mm dish and transiently transfected with ATF4 siRNA (0, 20, 40, 80 nM) or negative control siRNA (40 nM). After 48 h, total RNA was prepared for quantitative real-time RT-PCR analysis for Atf4, cyclin D1 and Foxo1 mRNAs that were normalized to Gapdh mRNA D: MTS assay. MC-4 cells were first seeded at a density of 5 × 10⁴ cells/cm2 in 100-mm dish and transiently transfected with 40 nM ATF4 siRNA or negative control siRNA. After 24 h, cells were re-seeded at 104 cells/well in 96-well plate in proliferation medium for indicated times followed by MTS assay. E–G: BrdU staining. MC-4 cells were seeded at 105 cells/well in 8-well chamber and transiently transfected with 40 nM ATF4 siRNA or negative control siRNA and cultured in proliferation medium for 4 days followed by BrdU staining. *P< 0.05 (control siRNA vs. ATF4 siRNA). Data represent mean ±SD. Experiments were repeated at least 3 times and qualitatively identical results were obtained. Arrows indicate BrdU-positive (proliferating) cells and Δ indicates BrdU-negative (non-proliferating) cells. [Color figure can be viewed in the online issue, which is available at www.interscience.wiley.com.]
Fig. 6
Fig. 6
Overexpression of ATF4 increases cyclin D1 expression. A–C: Quantitative real-time-RT/PCR. Atf4−/− BMSCs (2 × 10⁶ cells/group) were electroporated with increasing amounts of FLAG-ATF4-YFP expression vector (0, 0.5, 1, and 2 μg). The amount of plasmid DNAs was balanced as necessary with beta-galactosidase expression plasmid such that the total DNA was constant in each group. Thirty hours later, cells were harvested for the preparation of total RNA and quantitative real-time RT/PCR analysis. D: Western blot analysis. Cells were treated as in (A) and harvested for whole cell extracts preparation and Western blot analysis. *P< 0.05 (beta-gal vs. ATF4). Data represent mean ± SD. Experiments were repeated at least 3 times and qualitatively identical results were obtained.
Fig. 7
Fig. 7
Overexpression of ATF4 increases BMSC proliferation. A: Direct cell count. Atf4−/− BMSCs were electroporated as in Figure 6A. 5 × 10³ cells/well were seeded in 96-well plates in proliferation medium for 4 days followed by direct cell count using a hemacytometer. B: MTS assay. Cells were electroporated as in Figure 6A. After electroporation, cells were used for the MTS assay as in Figure 1C. C–E: BrdU staining. Cells were electroporated as in Figure 6A. After electroporation, cells were used for the BrdU staining. *P<0.05 (beta-gal vs. ATF4). Data represent mean ±SD. Experiments were repeated at least 3 times and qualitatively identical results were obtained. Arrows indicate BrdU-positive (proliferating) cells and Δ indicates BrdU-negative (nonproliferating) cells. [Color figure can be viewed in the online issue, which is available at www.interscience.wiley.com.]
Fig. 8
Fig. 8
ATF4 deficiency increases apoptosis in osteoblasts. A–C: Hoechst staining. wt and Atf4−/− BMSCs were seeded at a density of 5 × 10⁴ cells/cm2 in 35-mm dishes, cultured in proliferation medium for 4 days, and incubated with 1 μl of Hoechst dye at 37°C for 30 min. Cell images were obtained under UV light using a microscope (Olympus IX70). D–F: Apoptosis assay in BMSCs. wt and Atf4−/− BMSCs were seeded at 105 cells/well in 8-well chamber, cultured in proliferation medium for 4 days, and stained using the ApopTag Peroxidase In Situ Apoptosis Detection Kit according the manufacturer's instruction. G–I: Apoptosis assay in calvarial sections. Sections of calvariae from 6-week-old male wt and Atf4−/− mice (6 mice per group) were stained using the same kit. P<0.05 (wt vs. Atf4−/−). Data represent mean ±SD. Arrows indicate apoptotic cells and indicates nonapoptotic cells. [Color figure can be viewed in the online issue, which is available at www.interscience.wiley.com.]

References

    1. Adams JM. Ways of dying: Multiple pathways to apoptosis. Genes Dev. 2003;17:2481–2495. - PubMed
    1. Adams CM. Role of the transcription factor ATF4 in the anabolic actions of insulin and the anti-anabolic actions of glucocorticoids. J Biol Chem. 2007;282:16744–16753. - PubMed
    1. Ameri K, Lewis CE, Raida M, Sowter H, Hai T, Harris AL. Anoxic induction of ATF-4 through HIF-1-independent pathways of protein stabilization in human cancer cells. Blood. 2004;103:1876–1882. - PubMed
    1. Blais JD, Filipenko V, Bi M, Harding HP, Ron D, Koumenis C, Wouters BG, Bell JC. Activating transcription factor 4 is translationally regulated by hypoxic stress. Mol Cell Biol. 2004;24:7469–7482. - PMC - PubMed
    1. Brindle PK, Montminy MR. The CREB family of transcription activators. Curr Opin Genet Dev. 1992;2:199–204. - PubMed

Publication types

Substances

LinkOut - more resources