. 2008 Aug;5(8):1558-1570.
doi: 10.1002/cbdv.200890144.

Effects of vanadium-containing compounds on membrane lipids and on microdomains used in receptor-mediated signaling

Affiliations

Effects of vanadium-containing compounds on membrane lipids and on microdomains used in receptor-mediated signaling

Deborah A Roess et al. Chem Biodivers. 2008 Aug.

Abstract

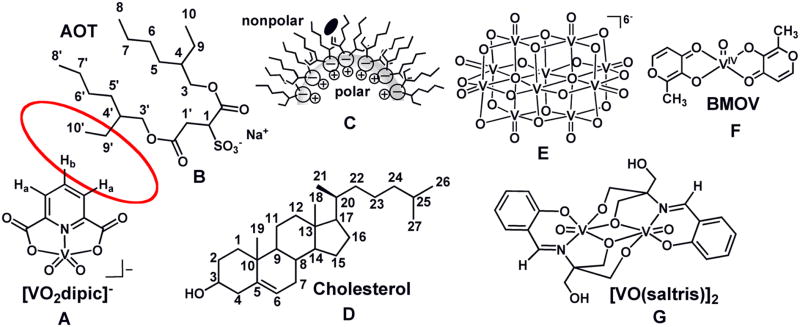
There is increasing evidence for the involvement of plasma membrane microdomains in insulin receptor function. Moreover, disruption of these structures, which are typically enriched in sphingomyelin and cholesterol, results in insulin resistance. Treatment strategies for insulin resistance include the use of vanadium (V) compounds which have been shown in animal models to enhance insulin responsiveness. One possible mechanism for insulin-enhancing effects might involve direct effects of V compounds on membrane lipid organization. These changes in lipid organization promote the partitioning of insulin receptors and other receptors into membrane microdomains where receptors are optimally functional. To explore this possibility, we have used several strategies involving V complexes such as [VO(2)(dipic)](-) (pyridin-2,6-dicarboxylatodioxovanadium(V)), decavanadate (V(10)O(28)(6-), V(10)), BMOV (bis(maltolato)oxovanadium(IV)), and [VO(saltris)](2) (2-salicylideniminato-2-(hydroxymethyl)-1,3-dihydroxypropane-oxovanadium(V)). Our strategies include an evaluation of interactions between V-containing compounds and model lipid systems, an evaluation of the effects of V compounds on lipid fluidity in erythrocyte membranes, and studies of the effects of V-containing compounds on signaling events initiated by receptors known to use membrane microdomains as signaling platforms.


Figures

Fig. 1
Fig. 1
The structure of [VO2dipic] (A). The structure of AOT (B). The schematic drawing of the location of [VO2dipic] in a isooctane microsuspension and the proposed -location in the more rigid cyclohexane system (C). The red circle between [VO2dipic] and AOT indicate the protons seeing each other in the NOESY spectrum (see Fig. 2 below). The structures of cholesterol (D), decavanadate (V10) (E), BMOV (F) and [VO(saltris)]2.
Fig. 2
Fig. 2
1H 2D NOESY was recorded of 100 mM [VO2dipic] complex in a 1M AOT/Isooctane /D2O (pH 4.5) microemulsion of w0 = 20.
Fig. 3
Fig. 3
The 51V NMR spectra (panel A) and the 1 H NMR spectra (panel B) of [VO2dipic] complex in a 1 M AOT/cyclohexane (C6H12) /D2O (pH 4.7).
Fig. 4
Fig. 4
The 1H NMR chemical shift of selected cholesterol protons prepared from cholesterol (30 mM) and AOT (120 mM) based w0 = 8 reverse micelle is shown as increasing concentrations of V10 (E in Fig. 1) is added to the water-pool of the reverse micelle. The chemical shifts for protons on carbons shown here are located as indicated in Fig. 1 on the structure.
Fig. 5
Fig. 5
Translocation of IR from higher density sucrose fractions to lower density sucrose fractions upon treatment with approximately 30 μM [VO(saltris]2. The relative amount of IR in each fraction was measured from western blots using a Biorad calibrated densitometer. Sucrose concentrations (") for each fraction were measured using a Bausch and Lomb refractometer.[Fig. is adapted with permission from Ref. [23].
Fig. 6
Fig. 6
Cell viability as measured by MTT assay following treatment with BMOV at increasing concentrations (each of concentration point was repeated 3–5 times but the error bars are covered by the symbols).
Fig. 7
Fig. 7
Ca2+ flux from untreated RBL-2H3 cells and cells exposed to 10 nM BMOV following crosslinking of FcεRI with DNP-BSA.
Fig. 8
Fig. 8
Figures showing insertion of GLUT4 (A: no insulin) in the plasma membrane. Membrane localization of GLUT4 in the plasma membrane following incubation of cells with 100 nM insulin (B).

References

    1. Schwille P, Korlach J, Webb W. Cytometry. 1999;36:176–182. - PubMed
    1. Saltiel A, Pessin J. Traffic. 2003;4:711–716. - PubMed
    1. Inokuchi J. Yakugaku Zasshi. 2007;127:579–586. - PubMed
    1. Vainio S, Bykov I, Hermansson M, Jokitalo E, Somerharju P, Ikonen E. Biochem J. 2005;391:465–472. - PMC - PubMed
    1. Shechter Y, Karlish SJD. Nature. 1980;284:556–558. - PubMed

Publication types

MeSH terms

LinkOut - more resources