. 2008 Jul;115(3):577-600.
doi: 10.1037/a0012667.

The overlap model: a model of letter position coding

Affiliations

The overlap model: a model of letter position coding

Pablo Gomez et al. Psychol Rev. 2008 Jul.

Abstract

Recent research has shown that letter identity and letter position are not integral perceptual dimensions (e.g., jugde primes judge in word-recognition experiments). Most comprehensive computational models of visual word recognition (e.g., the interactive activation model, J. L. McClelland & D. E. Rumelhart, 1981, and its successors) assume that the position of each letter within a word is perfectly encoded. Thus, these models are unable to explain the presence of effects of letter transposition (trial-trail), letter migration (beard-bread), repeated letters (moose-mouse), or subset/superset effects (faulty-faculty). The authors extend R. Ratcliff's (1981) theory of order relations for encoding of letter positions and show that the model can successfully deal with these effects. The basic assumption is that letters in the visual stimulus have distributions over positions so that the representation of one letter will extend into adjacent letter positions. To test the model, the authors conducted a series of forced-choice perceptual identification experiments. The overlap model produced very good fits to the empirical data, and even a simplified 2-parameter model was capable of producing fits for 104 observed data points with a correlation coefficient of .91.


Figures

Figure 1
Figure 1
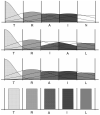
The figure shows a representation of the encoding of letter position according to the overlap model. The shaded areas represent the overlap between the string TRAIL (bottom panel) and three possible flashed strings: TRAIN, TRIAL, and TRAIL.
Figure 2
Figure 2
The figure represents a trial in the experiments presented in this article. First, there is a fixation point on the screen for 500 ms, then the target is flashed for 60 ms, and then the target is masked and two alternatives are presented. The participant is asked to choose which of the two alternatives was flashed.
Figure 3
Figure 3
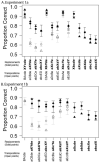
The figure shows the data and model fits for Experiments 1a (Panel A) and 1b (Panel B). The circles represent the data, and the triangle represents the model's fits. The different conditions are represented across the x-axis, and the proportion of correct responses is represented on the y-axis. Error bars indicate two standard errors of the mean.
Figure 4
Figure 4
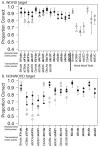
The figure shows the data and model fits for Experiment 2. A: Data and model fits for trials with word targets. B: Data and fits for trials with nonword targets. The circles represent the data, and the triangles represent the model's fits. The different conditions are represented across the x-axis, and the proportion of correct responses is represented on the y-axis. Error bars indicate two standard errors of the mean.
Figure 5
Figure 5
The figure shows the data and model fits for Experiment 3 (see text for description of the different types of items). The circles represent the data, and the triangles represent the model's fits. The different conditions are represented across the x-axis, and the proportion of correct responses is represented on the y-axis. Error bars indicate two standard errors of the mean.
Figure 6
Figure 6
The figure shows the data and model fits for Experiment 4. The circles represent the data, and the triangles represent the model's fits. The different conditions are represented across the x-axis, and the proportion of correct responses is represented on the y-axis. Error bars indicate two standard errors of the mean.
Figure 7
Figure 7
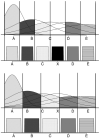
The figure shows a representation of the encoding of letter position with mismatching number of letters. In the top panel, the shaded areas represent the five-letter string ABCDE overlapping with the six-letter test string ABCXDE; in the bottom panel, the shaded areas represent the overlap between the six-letter string ABCXDE and the five-letter test string ABCDE.
Figure 8
Figure 8
The figure shows the data and model fits for Experiment 5. The circles represent the data, and the triangles represent the model's fits. The different conditions are represented across the x-axis, and the proportion of correct responses is represented on the y-axis. Note that there are two types of letter insertion trials: The letter insertion could be in the foil or in the target. Error bars indicate two standard errors of the mean.
Figure 9
Figure 9
Plot of the predictions of the overlap model and the empirical error rates across all experiments. The symbols correspond to the different types of experiments in this article. a = Experiment 1a (nonword target and foils); b = Experiment 1b (nonword targets and foils with no manipulations of the first letter); w = Experiment 2 (word targets and nonword foils); n = Experiment 2 (nonword targets and word foils); x = Experiment 2 (word targets and word foils); 3 = Experiment 3 (nonword targets and foils with letter migration); 4 = Experiment 4 (nonword targets and foils with double letters); 5 = Experiment 5 (nonword targets and foils with letter insertion).
Figure 10
Figure 10
Plot of the overlap value and the predicted error rates for all the experiments. The symbols correspond to the different types of experiments in this article. a = Experiment 1a (nonword target and foils); b = Experiment 1b (nonword targets and foils with no manipulations of the first letter); w = Experiment 2 (word targets and nonword foils); n = Experiment 2 (nonword targets and word foils); x = Experiment 2 (word targets and word foils); 3 = Experiment 3 (nonword targets and foils with letter migration); 4 = Experiment 4 (nonword targets and foils with double letters); 5 = Experiment 5 (nonword targets and foils with letter insertion).
Figure 11
Figure 11
Architecture of the open-bigram model. The alphabetic array is a bank of letter detectors that processes the visual stimulus. The information in the alphabetic array is decomposed in the relative position map, which in turn activates the whole-word representations in the O-word layer (adapted from Figure 1 in Grainger & van Heuven, 2003).
Figure 12
Figure 12
The different panels in the figure show the sequential coding in the SOLAR model for the words SLAT, SCAT, SALT and SOAP (adapted from Figure 1 in Davis & Bowers, 2004). Within each panel, the x-axis shows an unordered set of letters, and the y-axis shows the activation for each of these letters.
Figure 13
Figure 13
The bottom left panels show scatterplots of the similarity values for the four models (overlap model, SERIOL model, open-bigram model, and SOLAR model) and the error-rate data. The points are represented by numbers that correspond to the type of item: 1 = adjacent transpositions; 2 = nonadjacent transpositions; 3 = single replacements; 4 = adjacent replacements; 5 = nonadjacent replacements; 6 = letter migration; 7 = migration + insertion; 8 = double letters; 9 = nonadjacent letter repetition; 0 = letter insertion. The diagonal panels show histograms of values, and the top right panels show the correlations.
Figure 14
Figure 14
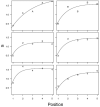
The different panels show the parameters s1 to s5 for each of the data sets A = Experiment 1a; B = Experiment 1b; 2 = Experiment 2; 3 = Experiment 3; 4 = Experiment 4; 5 = Experiment 5. The lines show the best fitting exponential approach to a limit function.
Figure 15
Figure 15
The figure shows plots of the similarity values for the two-parameter model (a rate r of 1.105 and an asymptote d of 1.617 for the exponential function in Equation 4). a = Experiment 1a; b = Experiment 1b; 3 = Experiment 3; 5 = Experiment 5.

References

    1. Acha J, Perea M. The effect of neighborhood frequency in reading: Evidence with transposed-letter neighbors. Cognition. 2008a;108:290–300. - PubMed
    1. Acha J, Perea M. The effects of length and transposed-letter similarity in lexical decision: Evidence with beginning, intermediate, and adult readers. British Journal of Psychology. 2008b;99:245–264. - PubMed
    1. Allport DA. On knowing the meaning of words we are unable to report: The effect of visual masking. In: Dornic S, editor. Attention and performance VI. Erlbaum; Hillsdale, NJ: 1977. pp. 505–533.
    1. Andrews S. Lexical retrieval and selection processes: Effects of transposed-letter confusability. Journal of Memory and Language. 1996;35:775–800.
    1. Ashby FG, Prinzmetal W, Ivry R, Maddox WT. A formal theory of feature binding in object perception. Psychological Review. 1996;103:165–192. - PubMed

Publication types