Role of tissue structure on ventricular wall mechanics
- PMID: 18751527
- PMCID: PMC2698048
Role of tissue structure on ventricular wall mechanics
Abstract
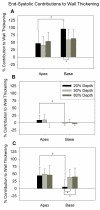
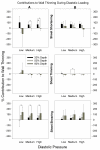
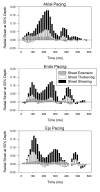
It is well known that systolic wall thickening in the inner half of the left ventricular (LV) wall is of greater magnitude than predicted by myofiber contraction alone. Previous studies have related the deformation of the LV wall to the orientation of the laminar architecture. Using this method, wall thickening can be interpreted as the sum of contributions due to extension, thickening, and shearing of the laminar sheets. We hypothesized that the thickening mechanics of the ventricular wall are determined by the structural organization of the underlying tissue, and may not be influenced by factors such as loading and activation sequence. To test this hypothesis, we calculated finite strains from biplane cineradiography of transmural markers implanted in apical (n = 22) and basal (n = 12) regions of the canine anterior LV free wall. Strains were referred to three-dimensional laminar microstructural axes measured by histology. The results indicate that sheet angle is of opposite sign in the apical and basal regions, but absolute value differs only in the subepicardium. During systole, shearing and extension of the laminae contribute the most to wall thickening, accounting for >90% (transmural average) at both apex and base. These two types of deformation are also most prominent during diastolic inflation. Increasing afterload has no effect on the pattern of systolic wall thickening, nor does reversing transmural activation sequence. The pattern of wall thickening appears to be a function of the orientation of the laminar sheets, which vary regionally and transmurally. Thus, acute interventions do not appear to alter the contributions of the laminae to wall thickening, providing further evidence that the structural architecture of the ventricular wall is the dominant factor for its regional mechanical function.
Figures


Similar articles
-
Heterogeneity of left ventricular wall thickening mechanisms.Circulation. 2008 Aug 12;118(7):713-21. doi: 10.1161/CIRCULATIONAHA.107.744623. Epub 2008 Jul 28. Circulation. 2008. PMID: 18663088 Free PMC article.
-
Effects of undersized mitral annuloplasty on regional transmural left ventricular wall strains and wall thickening mechanisms.Circulation. 2006 Jul 4;114(1 Suppl):I600-9. doi: 10.1161/CIRCULATIONAHA.105.001529. Circulation. 2006. PMID: 16820645
-
Laminar fiber architecture and three-dimensional systolic mechanics in canine ventricular myocardium.Am J Physiol. 1999 Feb;276(2):H595-607. doi: 10.1152/ajpheart.1999.276.2.H595. Am J Physiol. 1999. PMID: 9950861
-
Time-dependent remodeling of transmural architecture underlying abnormal ventricular geometry in chronic volume overload heart failure.Am J Physiol Heart Circ Physiol. 2004 Nov;287(5):H1994-2002. doi: 10.1152/ajpheart.00326.2004. Epub 2004 Jul 8. Am J Physiol Heart Circ Physiol. 2004. PMID: 15242833 Free PMC article.
-
Electromechanical activation sequence in normal heart.Heart Fail Clin. 2008 Jul;4(3):303-14. doi: 10.1016/j.hfc.2008.02.006. Heart Fail Clin. 2008. PMID: 18598982 Review.
Cited by
-
Quantitative study of the effect of tissue microstructure on contraction in a computational model of rat left ventricle.PLoS One. 2014 Apr 2;9(4):e92792. doi: 10.1371/journal.pone.0092792. eCollection 2014. PLoS One. 2014. PMID: 24695115 Free PMC article.
-
Transmural gradients of myocardial structure and mechanics: Implications for fiber stress and strain in pressure overload.Prog Biophys Mol Biol. 2016 Dec;122(3):215-226. doi: 10.1016/j.pbiomolbio.2016.11.004. Epub 2016 Nov 11. Prog Biophys Mol Biol. 2016. PMID: 27845176 Free PMC article. Review.
-
Myocardial strains from 3D displacement encoded magnetic resonance imaging.BMC Med Imaging. 2012 Apr 25;12:9. doi: 10.1186/1471-2342-12-9. BMC Med Imaging. 2012. PMID: 22533791 Free PMC article.
-
Cardiac mechanics in heart transplant recipients with and without transplant vasculopathy.Int J Cardiovasc Imaging. 2015 Apr;31(4):795-803. doi: 10.1007/s10554-015-0625-y. Epub 2015 Feb 20. Int J Cardiovasc Imaging. 2015. PMID: 25697723
-
Modeling the dispersion in electromechanically coupled myocardium.Int J Numer Method Biomed Eng. 2013 Nov;29(11):1267-84. doi: 10.1002/cnm.2575. Epub 2013 Jul 19. Int J Numer Method Biomed Eng. 2013. PMID: 23868817 Free PMC article.
References
-
- Dumesnil JG, Shoucri RM. J Appl Physiol. 1991;70:48–54. - PubMed
-
- Gould KL, Kennedy JW, Frimer M, Pollack GH, Dodge HT. The American Journal of Cardiology. 1976;38:322–331. - PubMed
-
- Gallagher K, Gerren R, Stirling M, Choy M, Dysko R, McManimon S, Dunham W. Circ Res. 1986;58:570–583. - PubMed
-
- Perrone-Filardi P, Bacharach S, Dilsizian V, Maurea S, Frank J, Bonow R. Circulation. 1992;86:1125–1137. - PubMed
Publication types
MeSH terms
Grants and funding
LinkOut - more resources
Full Text Sources
Miscellaneous
