. 2008 Aug 26;6(8):e215.
doi: 10.1371/journal.pbio.0060215.

Texture coding in the rat whisker system: slip-stick versus differential resonance

Affiliations

Texture coding in the rat whisker system: slip-stick versus differential resonance

Jason Wolfe et al. PLoS Biol. .

Abstract

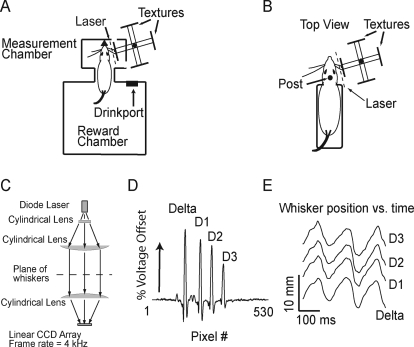
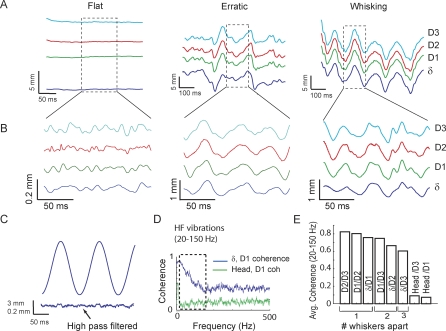
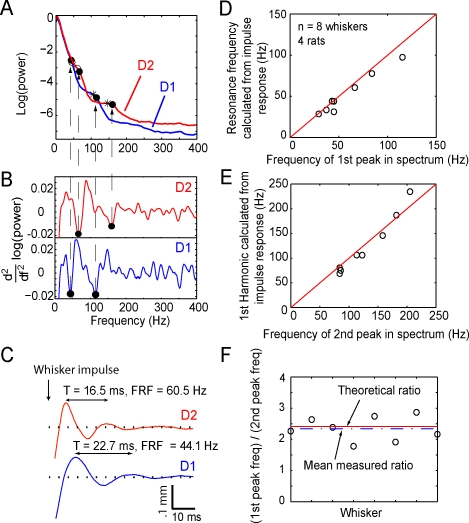
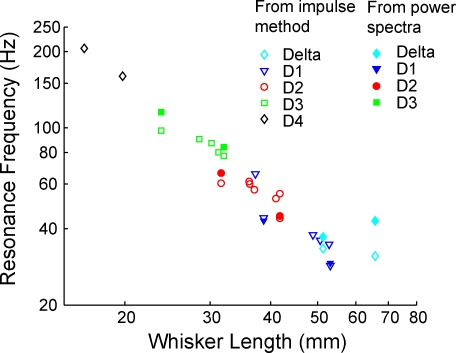
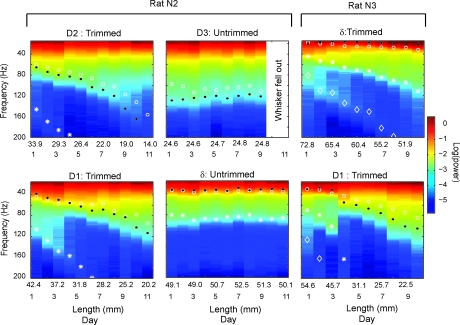
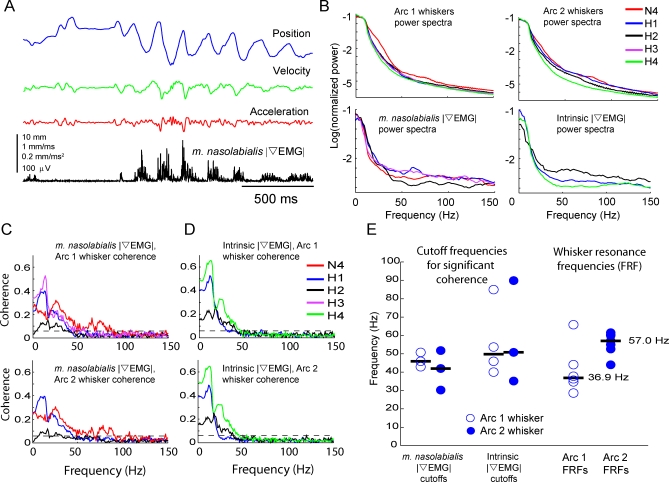
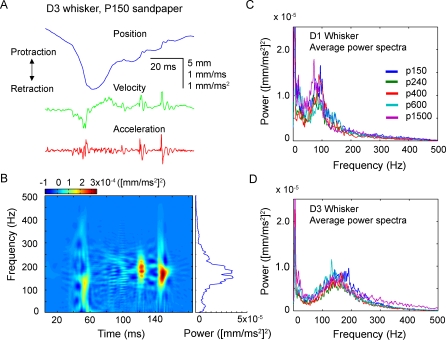
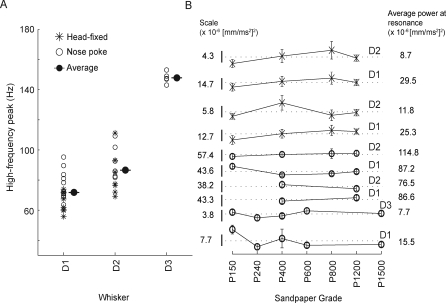
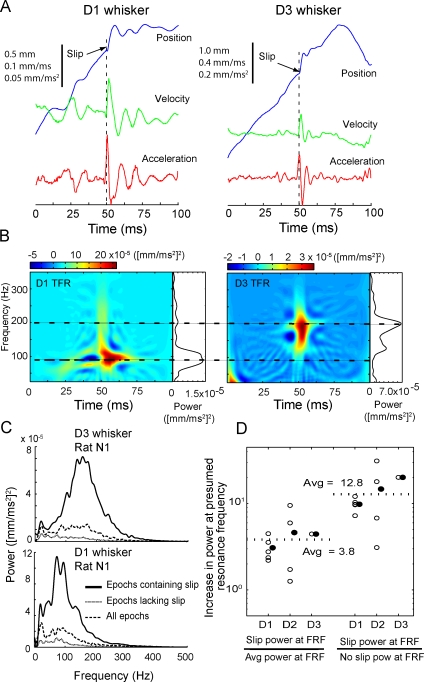
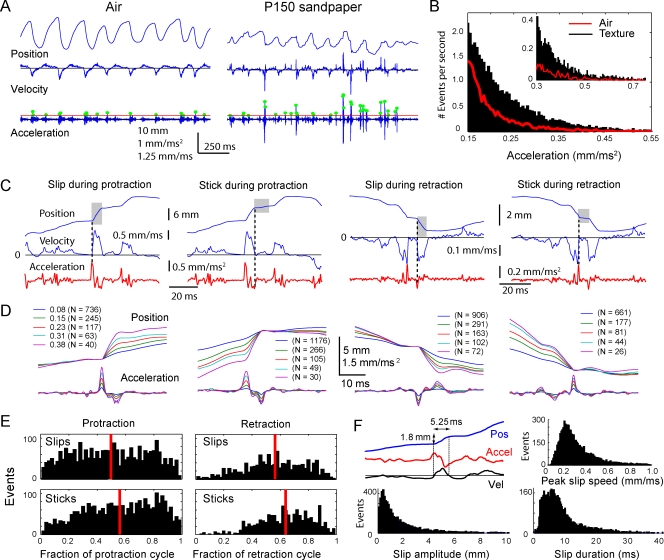
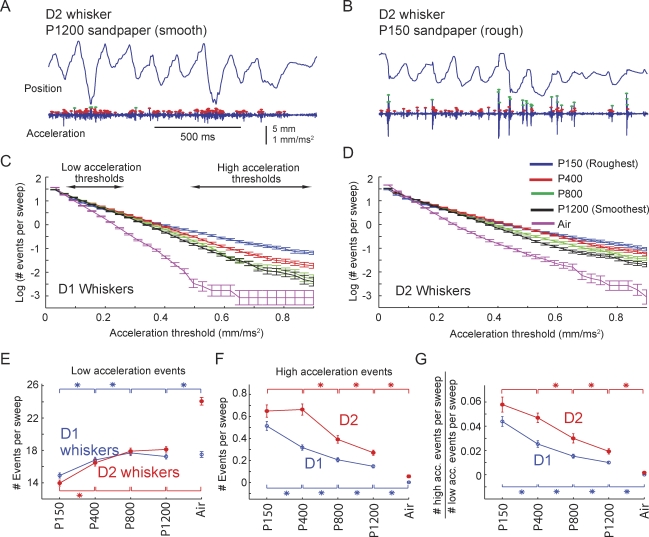
Rats discriminate surface textures using their whiskers (vibrissae), but how whiskers extract texture information, and how this information is encoded by the brain, are not known. In the resonance model, whisker motion across different textures excites mechanical resonance in distinct subsets of whiskers, due to variation across whiskers in resonance frequency, which varies with whisker length. Texture information is therefore encoded by the spatial pattern of activated whiskers. In the competing kinetic signature model, different textures excite resonance equally across whiskers, and instead, texture is encoded by characteristic, nonuniform temporal patterns of whisker motion. We tested these models by measuring whisker motion in awake, behaving rats whisking in air and onto sandpaper surfaces. Resonant motion was prominent during whisking in air, with fundamental frequencies ranging from approximately 35 Hz for the long Delta whisker to approximately 110 Hz for the shorter D3 whisker. Resonant vibrations also occurred while whisking against textures, but the amplitude of resonance within single whiskers was independent of texture, contradicting the resonance model. Rather, whiskers resonated transiently during discrete, high-velocity, and high-acceleration slip-stick events, which occurred prominently during whisking on surfaces. The rate and magnitude of slip-stick events varied systematically with texture. These results suggest that texture is encoded not by differential resonant motion across whiskers, but by the magnitude and temporal pattern of slip-stick motion. These findings predict a temporal code for texture in neural spike trains.


Conflict of interest statement

Competing interests. The authors have declared that no competing interests exist.

Figures

Figure 1
Figure 1. Training and Measurement Methods
(A) Training environment for whisking while in the nose poke. Black triangle, nose poke. Textures were mounted on a four-arm holder on a stepper motor, and were rotated into place between trials. Whisking in air was measured by omitting a texture from one of the arms. A plane of laser light (generated by the lens system in [C]) was projected from above, down through a slit in the floor, and onto a linear CCD imaging array below the cage. (B) Training setup for whisking in head-fixed animals. Animals were accommodated to being held in a Plexiglas tube and head-fixed via a post fixed to the tube. The head was placed in the same position and orientation relative to the surface and CCD imaging array as for animals whisking in the nose poke. (C) Side view of optical system for generating and tracking whisker shadows. Light from a diode laser was collimated into a line (1-mm wide, 60-mm long), projected onto the whiskers from above, and focused onto the linear CCD array below the training cage (D) Example of whisker shadows (voltage peaks) in a single-frame output of the CCD array. (E) Whisker motion over time revealed by tracking voltage peaks of four whisker shadows simultaneously.
Figure 2
Figure 2. High-Frequency Vibrations Are Present during Natural Whisker Motion in Air.
(A) Example epochs showing a stationary period (“flat”), erratic motion, and rhythmic whisker motion, for δ, D1, D2, and D3 whiskers measured simultaneously. (B) Bandpass-filtered (20–1,000 Hz) position traces for the segments shown in (A), showing high-frequency (HF) motion. (C) HF vibrations are absent in a mechanically driven whisker moving sinusoidally at 8 Hz. (D) Spectral coherence of D1 whisker motion and head motion in rat N4, and between D1 whisker and δ whisker motion. Dashed region indicates frequency range of HF vibrations (20–150 Hz). (E) Quantification of mean coherence in the 20–150 Hz frequency band between different whiskers, and between whisker motion and head motion, for rat N4.
Figure 3
Figure 3. Whiskers Preferentially Vibrate at Resonance Frequency during Whisking in Air
(A) Power spectra of whisker motion during whisking in air for the D1 and D2 whiskers of rat N2. Filled circles denote shoulders, identified as the points of maximum negative concavity (minima in the second derivative of the power spectra). Open circles and asterisks show the FRF and calculated first harmonic (respectively), measured by the impulse method in the anesthetized animal, after the behavioral recording session. (B) Second derivative of the power spectra in (A). (C) Impulse method for measuring FRF in the anesthetized animal, for the whiskers in (A). FRF is calculated from the period (T) of ringing after delivering a sharp impulse. (D) Relationship between FRF calculated by the impulse method and first peak of the power spectrum during whisking in air, for eight whiskers in four rats performing the nose poke task. (E) Relationship between calculated first harmonic of the FRF, measured by impulse method, and the second peak of the power spectrum during whisking in air. (F) Measured ratio of first peak to second peak in the power spectrum during whisking in air, for eight whiskers in four rats performing the nose poke task. Dashed line indicates the mean ratio. Solid line indicates the theoretical value of 2.41 for f 1/FRF ratio for a conical beam.
Figure 4
Figure 4. Map of Resonance Frequency under Anesthesia and during Whisking in Air
Resonance frequency versus whisker length for all whiskers measured, plotted on a log-log scale. Filled symbols, fundamental resonance frequency (FRF) during whisking in air, calculated as the first peak in the power spectrum during active whisking (same data as in Figure 3). Open symbols, FRF measured by the impulse method in anesthetized rats (includes data from Figure 3 and from 13 additional whiskers).
Figure 5
Figure 5. Whisker Trimming Causes Power Spectra during Whisking in Air to Shift Systematically to Higher Frequencies
Power spectra for whisker motion in air (colored vertical bars) measured daily in two animals during progressive whisker trimming. Rat N2 had the D1 and D2 whiskers trimmed approximately 2 mm per day. Rat N3 had the δ and D1 whiskers trimmed 2–4 mm per day. The D3 and δ whiskers of rat N2 remained untrimmed. Open circles, whisker FRF measured daily by the impulse method. Asterisks and diamonds, first and second harmonics of the measured FRF calculated using the truncated cone model of the whisker. Black dots are the calculated first shoulders of the power spectra (see Figure 3). Whisker length was measured daily, but for clarity, only alternate days' measurements are shown in the figure.
Figure 6
Figure 6. Coherence between Whisker Vibration and |∇EMG| of Whisker Muscles during Whisking in Air
(A) Example |∇EMG| from an extrinsic muscle and movement of the D1 whisker (rat H3). (B) Power spectra for whisker motion and |∇EMG| for all whiskers and muscles measured. Legend indicates animal identity. Each power spectrum was normalized to its total power. (C) Coherence between m. nasolabialis |∇EMG| and arc 1 whiskers (top) and arc 2 whiskers (bottom). Each line is coherence between one |∇EMG| recording and one whisker, recorded in one animal. Dashed black line shows p = 0.05 significance level. Coherence traces are color coded according to animal. (D) Coherence between intrinsic |∇EMG| and whisker motion. Plotted as in (B). (E) Cutoff frequencies for significant coherence between |∇EMG| recordings and whisker motion (frequency at which coherence dropped below significance), compared to measured FRFs for the same whiskers.
Figure 7
Figure 7. Whisker Resonance during Movement on Textured Surfaces
(A) D3 whisker position, velocity, and acceleration during one retraction–protraction cycle on P150 sandpaper (rat N1). (B) Time-frequency representation (TFR; color plot) of the whisker acceleration shown in (A). The trace on the right is the integrated TFR across the trial, which is equal to the average power spectrum. (C) Average power spectra (integrated TFRs) for D1 whisker motion for all protraction and retraction epochs onto five textures for rat N1, showing broad, high-frequency peak at approximately 80 Hz. (D) Average power spectra for D3 whisker motion onto the same five textures for rat N1, showing high-frequency peak at approximately 150 Hz.
Figure 8
Figure 8. Population Data for Whisker Resonance on Different Textured Surfaces
(A) High-frequency peak of the average power spectrum for all whiskers and all surfaces (asterisks indicate head-fixed animals, circles indicate nose poke animals). Each point is the average peak frequency of one whisker on one surface. Filled circles indicate the average across all individual measurements. (B) Average power at the presumed resonance frequency (high-frequency peak of the average power spectrum) as a function of texture, for each whisker for which measurements on multiple textures were made. Traces are offset vertically for clarity. Scale bars (left) show power for each trace. Dashed lines and right-hand numeric values show average power across textures (scale bar length is 50% of the average power). Average power did not substantially or systematically vary with texture.
Figure 9
Figure 9. Resonance Vibrations on Surfaces Represent Transient Ringing Following Discrete High-Acceleration Events
(A) Examples of high-acceleration whisker movement for a D1 and a D3 whisker in rat N1. Movement event onset is marked by an acceleration peak (aligned at 50 ms), followed by transient, decaying ringing in acceleration, velocity, and position. (B) TFR of the movement traces shown in (A), showing power at 90 Hz (D1 whisker) and 180 Hz (D3 whisker) following the high-acceleration event. (C) Comparison of average power spectra in 400-ms epochs containing a high-acceleration event (black), lacking such an event (dotted), or for all whisking epochs (dashed). Power spectra were derived from motion of the D1 and D3 whiskers in rat N1, averaged across all textures. (D) Analysis of increase in power at high-frequency (presumed resonance) peak during high-acceleration event, for all whiskers studied. Plot shows ratio of power at high-frequency peak in epochs containing high-acceleration events to power at this frequency for all whisking epochs (left), and to power at this frequency for epochs lacking high-acceleration events (right). Each open circle represents a single whisker averaged over all textures. Filled circles show average across all individual measured whiskers.
Figure 10
Figure 10. Characterization of Slips and Sticks
(A) Example of the motion of the D2 whisker of rat H1 in air and on rough (P150) sandpaper. Dots indicate acceleration transients greater than 4 s.d. above mean acceleration in air (red line). (B) Frequency of different magnitude acceleration events during whisking in air (red line) and onto textures (P150, P400, P800, and P1200 combined) (bars) for the D2 whisker in rat H1. Inset, expanded view of high-acceleration events. (C) Example of slip and stick events (gray boxes) during whisker protraction and retraction on texture. (D) From left to right: mean slip during protraction, stick during protraction, slip during retraction, and stick during retraction, for D2 whisker in rat H1. Mean events were compiled separately for events with peak acceleration in the ranges of 0.08–0.15, 0.15–0.23, 0.23–0.31, and 0.31–0.38 mm/ms2 (legend indicates base of this range). (E) Number of slip and stick events during different phases of protraction and retraction (n = 10 whiskers, 5 rats: N1, N2, N3, H1, and H2). (F) Distribution of slip amplitude (net change in whisker position; lower left) slip duration (lower right), and peak speed (upper right), compiled across all slips for the ten whiskers in (E). Upper left, example of magnitude and duration measurement for one slip event. Duration was measured as the time from initial acceleration peak to return of whisker velocity to mean velocity.
Figure 11
Figure 11. Relationship between High-Acceleration Slip/Stick Events and Texture
(A and B) Representative motion of the D2 whisker on P1200 (smooth) versus P150 (rough) sandpaper in rat H2 (same whisker as in Figure 10A). Red dots mark low-acceleration events (0.062–0.248 mm/ms2); green dots mark high-acceleration events (>0.496 mm/ms2). (C and D) Mean number of acceleration events per sweep (protraction or retraction movement) during whisking in air and on four sandpapers, calculated across three D1 whiskers and three D2 whiskers in three rats. Number of events per sweep is plotted on a log scale. Each point shows the cumulative number of events with acceleration greater than the threshold indicated on the x-axis. Error bars represent the standard error of the number of acceleration events per sweep (n = 644–1,247 sweeps per texture). (E) Number of low-acceleration events (events with acceleration in the range 0.062–0.248 mm/ms2, corresponding to 1–4 s.d. above zero) measured on four textures and air. Asterisks indicate significantly different numbers of events between the indicated textures, for the D1 whisker (blue) and the D2 whisker (red) (Mann-Whitney U-test, p < 0.01). (F) Number of high-acceleration events (>0.496 mm/ms2, 8 s.d. above zero) across four textures and air. (G) Ratio of the number of high- to low-acceleration events per sweep, as a function of texture roughness. Data shown in (E–G) are from three D1 whiskers and three D2 whiskers; error bars are the standard error bars calculated for the number of events per sweep, as in (C) and (D).

Comment in

  • Whisker-mediated texture discrimination.
    Diamond ME, von Heimendahl M, Arabzadeh E. Diamond ME, et al. PLoS Biol. 2008 Aug 26;6(8):e220. doi: 10.1371/journal.pbio.0060220. PLoS Biol. 2008. PMID: 18752356 Free PMC article.

References

    1. Heller MA. Texture perception in sighted and blind observers. Percept Psychophys. 1989;45:49–54. - PubMed
    1. Prigg T, Goldreich D, Carvell GE, Simons DJ. Texture discrimination and unit recordings in the rat whisker/barrel system. Physiol Behav. 2002;77:671–675. - PubMed
    1. Guic-Robles E, Valdivieso C, Guajardo G. Rats can learn a roughness discrimination using only their vibrissal system. Behav Brain Res. 1989;31:285–289. - PubMed
    1. Guic-Robles E, Jenkins WM, Bravo H. Vibrissal roughness discrimination is barrelcortex-dependent. Behav Brain Res. 1992;48:145–152. - PubMed
    1. Carvell GE, Simons DJ. Biometric analyses of vibrissal tactile discrimination in the rat. J Neurosci. 1990;10:2638–2648. - PMC - PubMed

Publication types