. 2009 Jul;21(7):1380-95.
doi: 10.1162/jocn.2009.21093.

Does white matter matter? Spatio-temporal dynamics of task switching in aging

Affiliations

Does white matter matter? Spatio-temporal dynamics of task switching in aging

Gabriele Gratton et al. J Cogn Neurosci. 2009 Jul.

Abstract

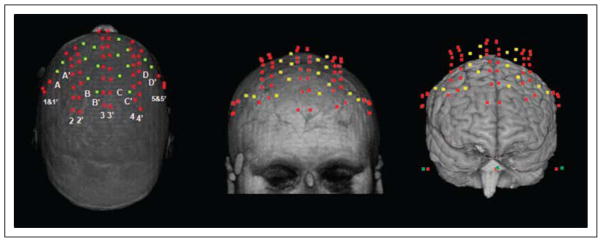
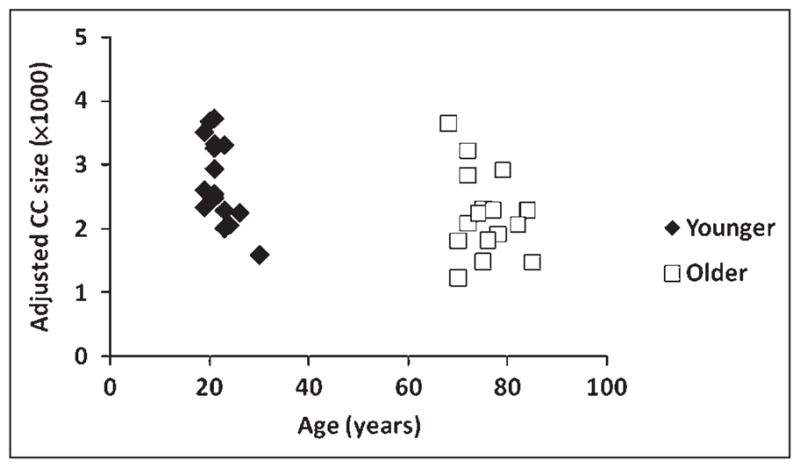
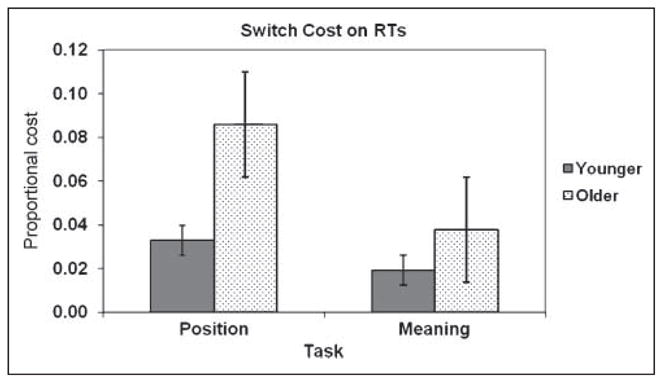
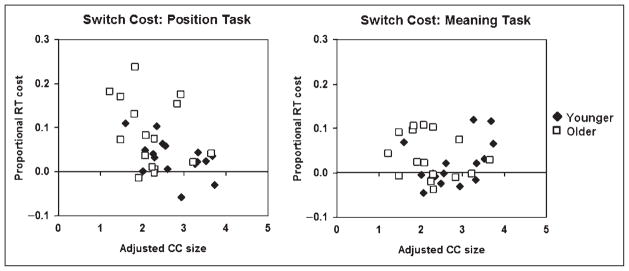
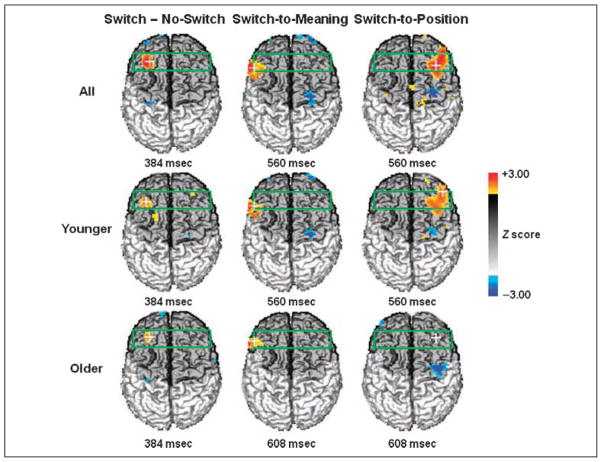
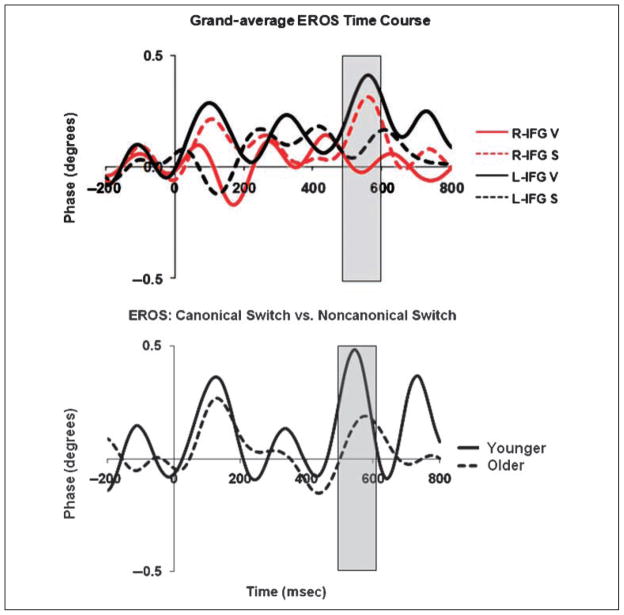
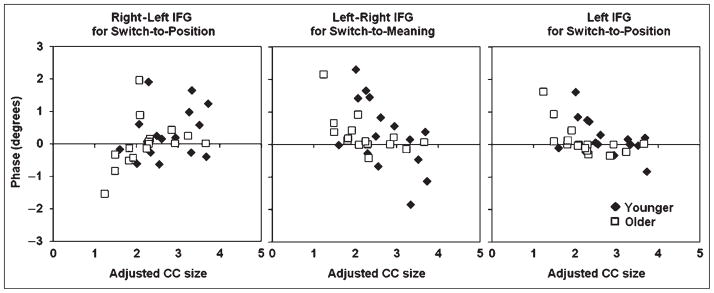
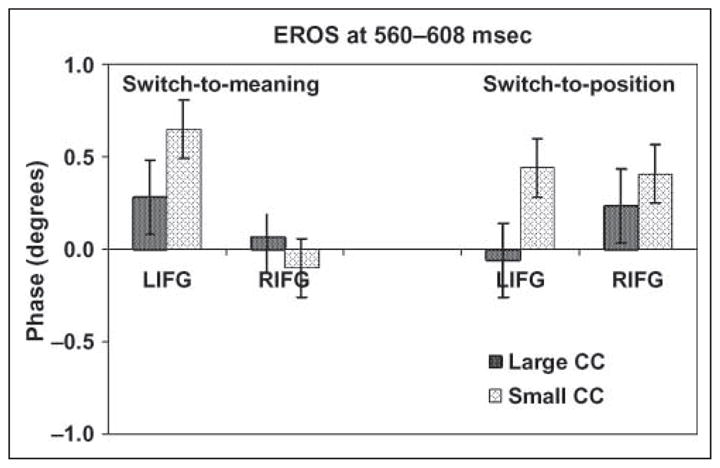
Older adults often encounter difficulties in switching between tasks, perhaps because of age-related decreases in executive function. Executive function may largely depend on connections between brain areas-connections that may become structurally and functionally weaker in aging. Here we investigated functional and structural age-related changes in switching between a spatial and a verbal task. These tasks were chosen because they are expected to differentially use the two hemispheres. Brain measures included anatomical information about anterior corpus callosum size (CC; the major commissure linking the left and right hemisphere), and the event-related optical signal (EROS). Behavioral results indicated that older adults had greater task-switching difficulties, which, however, were largely restricted to switching to the spatial task and to individuals with smaller anterior CCs. The EROS data showed both general switching-related activity in the left middle frontal gyrus (with approximately 300-msec latency) and task-specific activity in the inferior frontal gyrus, lateralized to the left for the switch-to-verbal condition and to the right for the switch-to-spatial condition. This lateralization was most evident in younger adults. In older adults, activity in the switch-to-spatial condition was lateralized to the right hemisphere in individuals with large CC, and to the left in individuals with small CC. These data suggest that (a) task switching may involve both task-general and task-specific processes; and (b) white matter changes may underlie some of the age-related problems in switching. These effects are discussed in terms of the hypothesis that aging involves some degree of cortical disconnection, both functional and anatomical.


Figures

Figure 1
Figure 1
The digitized locations of sources (red) and detectors (yellow) coregistered with a structural MRI viewed from the axial (left panel, nose at top) and coronal (middle panel) planes, and projected onto the brain (right panel). The numbered and lettered rows in the left panel indicate the montage for a given session (e.g., row B and row 3 would be used for one montage and row B′ and row 3′ would be used for the second montage, with the order of montages counterbalanced across subjects).
Figure 2
Figure 2
Scatterplot of volume-adjusted anterior corpus callosum (CC) size by age. CC size is expressed as a proportion of the total brain volume (multiplied by 1000).
Figure 3
Figure 3
Average RT switch costs expressed as proportional increases in the RT for switch trials compared to that for no-switch trials, separately for each age group and task. Error bars refer to the standard error across subjects.
Figure 4
Figure 4
Scatterplots depicting the relationship between proportional RT switch costs and the size of the anterior third of the corpus callosum (CC; adjusted by total brain volume), separately for the position task (left) and meaning task (right).
Figure 5
Figure 5
(A) Grand-average statistical event-related optical signal (EROS) maps (Z scores) for all subjects (top row), younger subjects (middle row), and older subjects (bottom row), for the difference between switch and no-switch trials combined across tasks (left column), for the meaning condition (middle column) and for the position condition (right column). The green box indicates the ROI used for analysis. The darker shade of gray indicates the areas from which optical data were recorded. The latency (msec) relative to the cue at which each map was derived is displayed beneath the corresponding map.
Figure 6
Figure 6
(Top) Grand-average time courses of event-related optical signal (EROS) activity (differences between switch and no-switch trials) from the peak locations of MFG/IFG activity, collapsed across age groups. R-IFG V = right MFG/IFG, switch-to-meaning (verbal) task; R-IFG S = right MFG/IFG, switch-to-position (spatial) task; L-IFG V = left MFG/IFG, switch-to-meaning task; L-IFG S = left MFG/IFG, switch-to-position task. (Bottom) Grand-average switch minus no-switch EROS lateralization waveforms obtained by subtracting the values recorded from the left MFG/IFG from those recorded from the right MFG/IFG for the position task, and vice versa for the meaning task. Separate waveforms were computed for younger (solid) and older (dashed) subjects. Time is expressed in milliseconds (msec), referred to the onset of the cue. In both the top and bottom panels, the transparent overlay indicates the interval where the largest ERP effect was observed.
Figure 7
Figure 7
Scatterplots depicting the relationship between the size of the anterior third of the corpus callosum (CC; adjusted by total brain volume) and event-related optical signal (EROS) measures from the MFG/IFG (at a latency of 560 msec for the younger subjects and 608 msec for the older subjects). In all three plots, younger subjects are indicated by filled diamonds and older subjects by open squares. Left: relationship between CC size and amount of lateralization (difference between the activity in the right and left MFG/IFG for the switch/no-switch contrast) for the position task. Middle: relationship between CC size and amount of lateralization (difference between activity in the left and right MFG/IFG for the switch/no-switch contrast) for the meaning task. Right: relationship between CC size and activity in the left MFG/IFG only for the switch/no-switch contrast in the position task.
Figure 8
Figure 8
Grand-average activations in the left (LIFG) and right (RIFG) MFG/IFG at a latency of 560 msec (for younger subjects) and 608 msec (for older subjects) for each switch contrast (switch/ no-switch conditions). Separate averages are presented for subjects with large (darker bars) and small (lighter bars) adjusted corpus callosum (CC) size (using a median split to separate subjects into groups), and for each task. The error bars are based on standard error across subjects.

Similar articles

Cited by

References

    1. Agran J, Low KA, Ryklevskaia EI, Fabiani M, Gratton G. When the rules keep changing: The timing of activation of task-general and task-specific brain regions involved in preparation submitted.
    1. Aron AR, Monsell S, Sahakian BJ, Robbins TW. A componential analysis of task-switching deficits associated with lesions of left and right frontal cortex. Brain. 2004;127:1561–1573. - PubMed
    1. Ashburner J, Friston KJ. Voxel-based morphometry: The methods. Neuroimage. 2000;11:805–821. - PubMed
    1. Ashburner J, Friston KJ. Why voxel-based morphometry should be used. Neuroimage. 2001;14:1454–1462. - PubMed
    1. Beck AT, Steer RA, Brown GK. Manual for the Beck depression inventory. 2. San Antonio, TX: The Psychological Corporation; 1996.

Publication types

MeSH terms