. 2008 Nov 14;283(46):31949-59.
doi: 10.1074/jbc.M804784200. Epub 2008 Aug 26.

Neuronostatin encoded by the somatostatin gene regulates neuronal, cardiovascular, and metabolic functions

Affiliations

Neuronostatin encoded by the somatostatin gene regulates neuronal, cardiovascular, and metabolic functions

Willis K Samson et al. J Biol Chem. .

Abstract

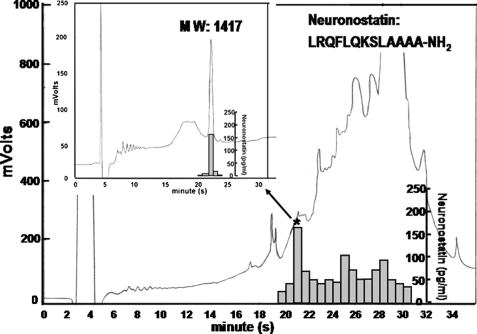
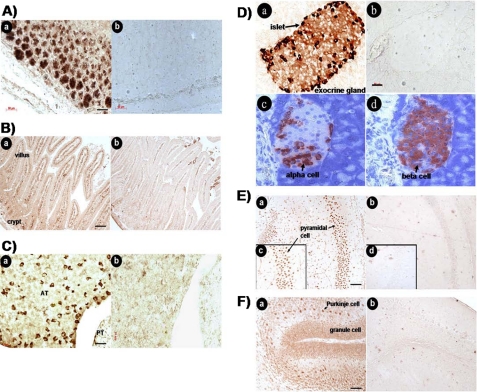
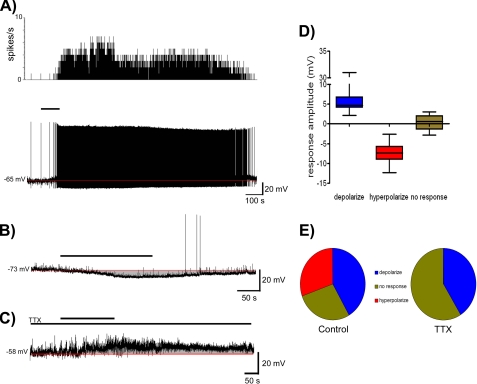
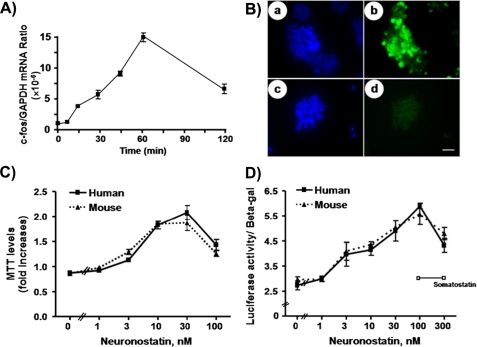
Somatostatin is important in the regulation of diverse neuroendocrine functions. Based on bioinformatic analyses of evolutionarily conserved sequences, we predicted another peptide hormone in pro-somatostatin and named it neuronostatin. Immuno-affinity purification allowed the sequencing of an amidated neuronostatin peptide of 13 residues from porcine tissues. In vivo treatment with neuronostatin induced c-Fos expression in gastrointestinal tissues, anterior pituitary, cerebellum, and hippocampus. In vitro treatment with neuronostatin promoted the migration of cerebellar granule cells and elicited direct depolarizing actions on paraventricular neurons in hypothalamic slices. In a gastric tumor cell line, neuronostatin induced c-Fos expression, stimulated SRE reporter activity, and promoted cell proliferation. Furthermore, intracerebroventricular treatment with neuronostatin increased blood pressure but suppressed food intake and water drinking. Our findings demonstrate diverse neuronal, neuroendocrine, and cardiovascular actions of a somatostatin gene-encoded hormone and provide the basis to investigate the physiological roles of this endogenously produced brain/gut peptide.


Figures

FIGURE 1.
FIGURE 1.
Bioinformatic prediction of conserved neuronostatin. Based on a computer program previously used to identify unique protein signatures (42), we searched for potential mono- or di-basic cleavage sites in ∼200 known prepro-hormone sequences. Candidate regions were further checked for evolutionary conservation of putative mature peptide regions in diverse species. Amino acid sequences of prepro-somatostatin from different vertebrates are shown with the signal peptide (underlined), mature somatostatin (shaded), and the predicted neuronostatin (bold letters). Consensus basic residues representing putative convertase cleavage sites are shown as white letters on a black background. In the consensus sequence, individual residues with conservation in at least 11 of 13 species are shown in uppercase. Because of the existence of a conserved glycine residue at its C terminus, mature neuronostatin is predicted to be amidated. In addition, the total length of neuronostatin could be variable (6, 11, 13, and 19 residues) due to the presence of conserved basic residues as potential proteolytic cleavage sites (arrows). GenBank™ (gi) numbers for individual somatostatin genes are 4507243 (human), 55621730 (chimpanzee), 57528038 (pig), 50979130 (dog), 57163953 (sheep), 73697560 (cattle), 6678035 (mouse), 6981582 (rat), 45385811 (chicken), 32454336 (frog), 9978804 (lungfish), 34098954 (zebrafish), and 9978923 (goldfish).
FIGURE 2.
FIGURE 2.
Isolation of neuronostatin from porcine pancreas using immunoaffinity purification followed by HPLC and Edman sequencing. Porcine pancreatic extracts were purified using immunoaffinity beads covalently linked with antibodies against human/porcine neuronostatin-19. Following reverse-phase HPLC, the effluent was monitored based on the absorption at 220 nm in mV, and immunoreactive neuronostatin (bar graph) was determined by the human/porcine neuronostatin-19 RIA. The peak fraction (*) showing immunoreactivity was re-purified using HPLC (inset) before determination of molecular weight by MALDI-TOF mass spectrometry and sequencing.
FIGURE 3.
FIGURE 3.
Immunohistochemical staining of neuronostatin and somatostatin in different tissues. A, pancreas; B, stomach; C, small intestine. Tissues were obtained from adult male mice and fixed before staining with neuronostatin or somatostatin antibodies. Panels a, staining with neuronostatin antibodies; b, staining with somatostatin antibodies; and c, staining with preimmune IgG.
FIGURE 4.
FIGURE 4.
Neuronostatin induction of early response genes in diverse tissues. A, stomach; B, jejunum; C, anterior pituitary; D, pancreas; E, cerebellum; and F, hippocampus. Adult male mice were treated with an intraperitoneal injection of neuronostatin (1,000 nmol/kg body weight) before analyses of c-Fos or c-Jun expression 3 h later using immunohistochemistry. For studies of brain regions, immature male rats (7 days of age) were treated i.c.v. with saline (3 μl), or vehicle containing neuronostatin (15 nmol/kg body weight) into the left ventricle. Brain tissues were obtained at 1.5 h after injection. Immunohistochemical staining was performed using c-Fos (A, B, C, E, and F) or c-Jun (D) antibodies. For all figures: panels a, neuronostatin-treated; b, saline-treated. For pancreas (D), panels c and d represent immunostaining using antibodies against glucagon and insulin, respectively. For the hippocampus (F), panels c and d represent areas of higher magnification. AT, anterior pituitary; PT, posterior pituitary.
FIGURE 5.
FIGURE 5.
Neuronostatin attracts the growth cone of cerebellar granule cells. A, microscopic images of the growth cone of a cultured cerebellar granule neuron at the beginning (0 min) and the end (30 min) of exposure to a neuronostatin gradient (50 μm in the pipette, top) or control solution (PBS, bottom). The arrows indicate the direction of the gradient. B, upper panel, cumulative distribution of growth cone turning angles for neurons treated with PBS or a gradient of neuronostatin (50 and 500 μm). Lower panel, histograms represent the average turning angles during the 30-min assay for all neurons examined. Numbers of neurons tested are indicated in parentheses. Asterisks indicate data significantly different from the control (p < 0.01). Error bars indicate S.E.
FIGURE 6.
FIGURE 6.
Effects of neuronostatin treatment on the excitability of PVN neurons. A, rate meter record of action potential frequency (top) and current clamp trace (bottom) showing neuronostatin induced depolarization of a PVN neuron. The thick bar indicates duration of neuronostatin (10 nm) application, while the red line indicates baseline membrane potential. B, current clamp recording trace showing the hyperpolarization of a different PVN neuron following neuronostatin application. C, current clamp recording trace showing neuronostatin-induced depolarization of a PVN neuron in the presence of TTX (1 μm). D, box and whiskers plot summarizing the effects of treatment with 10 nm neuronostatin on PVN neurons. Responses were grouped as depolarizing, hyperpolarizing, and no response according to a response exceeding 2× standard deviation of the baseline mean. E, pie charts illustrating the proportion of paraventricular neurons that depolarized, hyperpolarized, or did not respond to neuronostatin treatment under control conditions (incubated with artificial cerebrospinal fluid) or during synaptic isolation in the presence of TTX.
FIGURE 7.
FIGURE 7.
Neuronostatin stimulation of c-Fos expression, proliferation, and SRE-luciferase reporter activity in human gastric tumor cells. A, KATO-III cells were treated with neuronostatin (10 nm) for different periods before measurement of c-Fos transcript levels. B, cells with or without neuronostatin (10 nm) treatment for 1 h were stained using c-Fos antibodies (panels b and d). Panels a and c represent cell nuclei staining using the Hoechst 33342 dye. C, neuronostatin peptides stimulated KATO-III cell proliferation based on the MTT assay. D, neuronostatin stimulation of luciferase activity in KATO-III cells transfected with an SRE-luciferase reporter construct.
FIGURE 8.
FIGURE 8.
Intracerebroventricular administration of neuronostatin increased arterial pressure in rats. A, changes in MAP from preinjection baseline are demonstrated for animals treated with saline or 0.3 nmol of neuronostatin. The biphasic nature of the increase in MAP can be observed with an initial, transient elevation that resolved at 10 min, followed by another increase over the remaining 35 min of the observation. B, MAP changes in response to different doses of neuronostatin (area under curve, AUC, n = 7-8 per group) for the initial 10 min period (Phase One), the subsequent 35-min period (Phase Two), and the total observation period. *, p < 0.05 compared with saline vehicle controls (Mann-Whitney U test).
FIGURE 9.
FIGURE 9.
Intracerebroventricular administration of neuronostatin suppressed food intake and water drinking in rats. Adult Sprague-Dawley rats were implanted intracerebroventricularly with a cannula before testing the effects of neuronostatin on ad libitum food intake and water drinking. Intracerebroventricular injection of neuronostatin was performed through an implanted cannula at 1550 h and food provided at 1600 h. Food and water intakes were monitored at 30-min intervals. *, p < 0.05; **, p < 0.01; ***, p < 0.001 versus saline-injected group.

References

    1. Vale, W., Brazeau, P., Grant, G., Nussey, A., Burgus, R., Rivier, J., Ling, N., and Guillemin, R. (1972) C. R. Acad. Sci. Hebd. Seances. Acad. Sci. D 275 2913-2916 - PubMed
    1. Brazeau, P., Vale, W., Burgus, R., Ling, N., Butcher, M., Rivier, J., and Guillemin, R. (1973) Science 179 77-79 - PubMed
    1. Reichlin, S. (1983) N. Engl. J. Med. 309 1495-1501 - PubMed
    1. Lamberts, S. W., Krenning, E. P., and Reubi, J. C. (1991) Endocr. Rev. 12 450-482 - PubMed
    1. Low, M. J. (2004) Best Pract. Res. Clin. Endocrinol. Metab. 18 607-622 - PubMed

Publication types

MeSH terms

LinkOut - more resources