

Gene-environment interactions in the causation of neural tube defects: folate deficiency increases susceptibility conferred by loss of Pax3 function
- PMID: 18753144
- PMCID: PMC2581426
- DOI: 10.1093/hmg/ddn262
Gene-environment interactions in the causation of neural tube defects: folate deficiency increases susceptibility conferred by loss of Pax3 function
Abstract
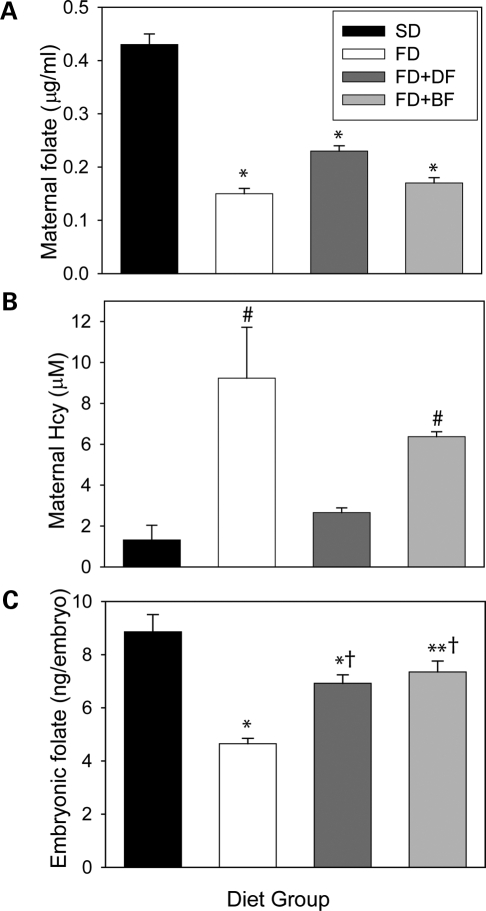
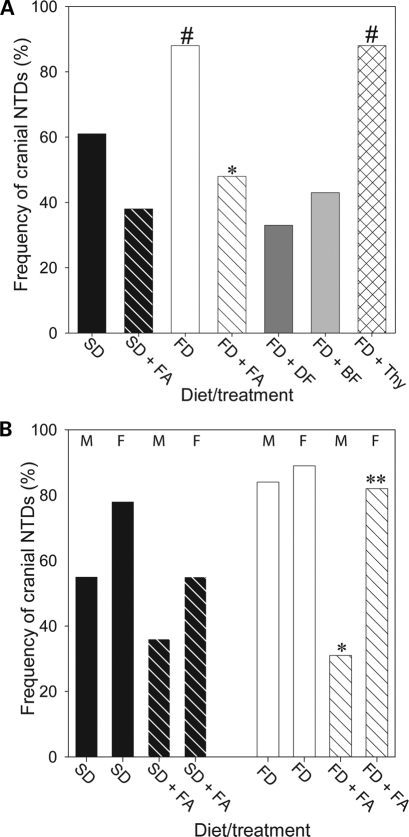
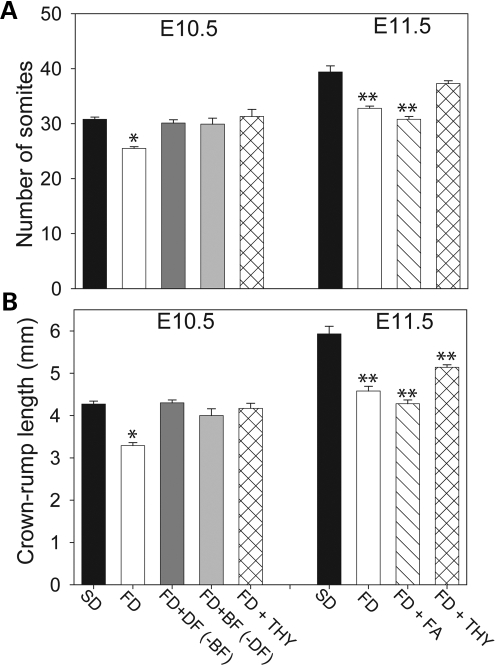
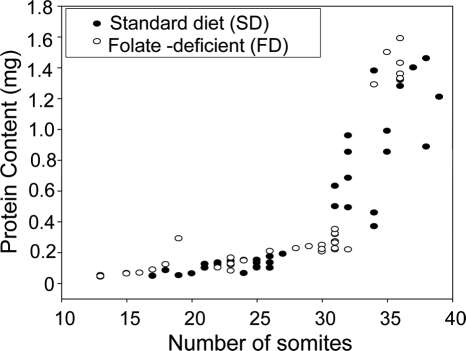
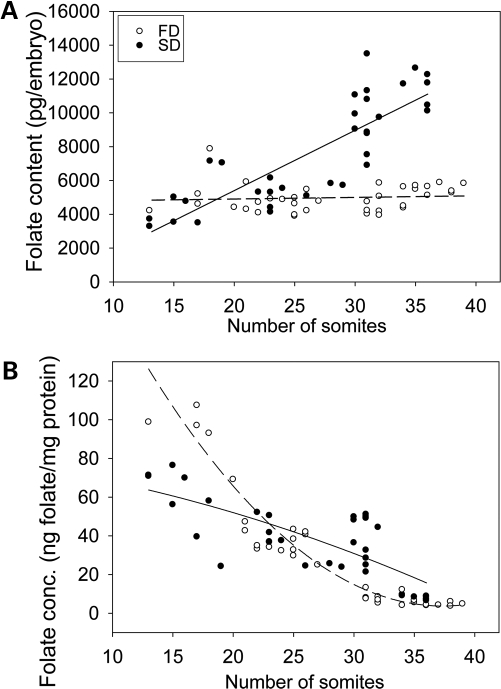
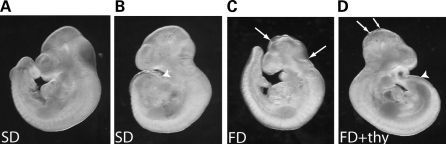
Risk of neural tube defects (NTDs) is determined by genetic and environmental factors, among which folate status appears to play a key role. However, the precise nature of the link between low folate status and NTDs is poorly understood, and it remains unclear how folic acid prevents NTDs. We investigated the effect of folate level on risk of NTDs in splotch (Sp(2)(H)) mice, which carry a mutation in Pax3. Dietary folate restriction results in reduced maternal blood folate, elevated plasma homocysteine and reduced embryonic folate content. Folate deficiency does not cause NTDs in wild-type mice, but causes a significant increase in cranial NTDs among Sp(2)(H) embryos, demonstrating a gene-environment interaction. Control treatments, in which intermediate levels of folate are supplied, suggest that NTD risk is related to embryonic folate concentration, not maternal blood folate concentration. Notably, the effect of folate deficiency appears more deleterious in female embryos than males, since defects are not prevented by exogenous folic acid. Folate-deficient embryos exhibit developmental delay and growth retardation. However, folate content normalized to protein content is appropriate for developmental stage, suggesting that folate availability places a tight limit on growth and development. Folate-deficient embryos also exhibit a reduced ratio of s-adenosylmethionine (SAM) to s-adenosylhomocysteine (SAH). This could indicate inhibition of the methylation cycle, but we did not detect any diminution in global DNA methylation, in contrast to embryos in which the methylation cycle was specifically inhibited. Hence, folate deficiency increases the risk of NTDs in genetically predisposed splotch embryos, probably via embryonic growth retardation.
Figures
Similar articles
-
Impact of methylenetetrahydrofolate reductase deficiency and low dietary folate on the development of neural tube defects in splotch mice.Birth Defects Res A Clin Mol Teratol. 2006 Jan;76(1):55-9. doi: 10.1002/bdra.20223. Birth Defects Res A Clin Mol Teratol. 2006. PMID: 16397891
-
Neural tube defects induced by folate deficiency in mutant curly tail (Grhl3) embryos are associated with alteration in folate one-carbon metabolism but are unlikely to result from diminished methylation.Birth Defects Res A Clin Mol Teratol. 2010 Aug;88(8):612-8. doi: 10.1002/bdra.20690. Birth Defects Res A Clin Mol Teratol. 2010. PMID: 20589880 Free PMC article.
-
The genetic background of the curly tail strain confers susceptibility to folate-deficiency-induced exencephaly.Birth Defects Res A Clin Mol Teratol. 2010 Feb;88(2):76-83. doi: 10.1002/bdra.20632. Birth Defects Res A Clin Mol Teratol. 2010. PMID: 19824061 Free PMC article.
-
Understanding the causes and prevention of neural tube defects: Insights from the splotch mouse model.Birth Defects Res A Clin Mol Teratol. 2009 Apr;85(4):322-30. doi: 10.1002/bdra.20539. Birth Defects Res A Clin Mol Teratol. 2009. PMID: 19180568 Review.
-
Nutri-epigenomic Studies Related to Neural Tube Defects: Does Folate Affect Neural Tube Closure Via Changes in DNA Methylation?Mini Rev Med Chem. 2015;15(13):1095-102. doi: 10.2174/1389557515666150909144828. Mini Rev Med Chem. 2015. PMID: 26349489 Review.
Cited by
-
Pathogenesis of neural tube defects: The regulation and disruption of cellular processes underlying neural tube closure.WIREs Mech Dis. 2022 Sep;14(5):e1559. doi: 10.1002/wsbm.1559. Epub 2022 May 3. WIREs Mech Dis. 2022. PMID: 35504597 Free PMC article. Review.
-
Disruption of Folate Metabolism Causes Poor Alignment and Spacing of Mouse Conceptuses for Multiple Generations.Front Cell Dev Biol. 2021 Dec 10;9:723978. doi: 10.3389/fcell.2021.723978. eCollection 2021. Front Cell Dev Biol. 2021. PMID: 34957089 Free PMC article.
-
p53 Disruption Increases Uracil Accumulation in DNA of Murine Embryonic Fibroblasts and Leads to Folic Acid-Nonresponsive Neural Tube Defects in Mice.J Nutr. 2020 Jul 1;150(7):1705-1712. doi: 10.1093/jn/nxaa090. J Nutr. 2020. PMID: 32271909 Free PMC article.
-
High levels of iron supplementation prevents neural tube defects in the Fpn1ffe mouse model.Birth Defects Res. 2017 Jan 30;109(2):81-91. doi: 10.1002/bdra.23542. Birth Defects Res. 2017. PMID: 28008752 Free PMC article.
-
Genetic association of the glycine cleavage system genes and myelomeningocele.Birth Defects Res A Clin Mol Teratol. 2016 Oct;106(10):847-853. doi: 10.1002/bdra.23552. Epub 2016 Sep 13. Birth Defects Res A Clin Mol Teratol. 2016. PMID: 27620832 Free PMC article.
References
-
- Copp A.J., Greene N.D.E., Murdoch J.N. The genetic basis of mammalian neurulation. Nat. Rev. Genet. 2003;4:784–793. - PubMed
-
- Boyles A.L., Hammock P., Speer M.C. Candidate gene analysis in human neural tube defects. Am. J. Med. Genet. C. Semin. Med. Genet. 2005;135:9–23. - PubMed
-
- Copp A.J., Bernfield M. Etiology and pathogenesis of human neural tube defects: insights from mouse models. Curr. Opin. Pediatr. 1994;6:624–631. - PubMed
-
- Van der Put N.M.J., Van Straaten H.W.M., Trijbels F.J.M., Blom H.J. Folate, homocysteine and neural tube defects: an overview. Proc. Soc. Experiment. Biol. Med. 2001;226:243–270. - PubMed
Publication types
MeSH terms
Substances
Grants and funding
LinkOut - more resources
Full Text Sources
Medical
Molecular Biology Databases
