. 2008 Nov 1;24(21):2474-81.
doi: 10.1093/bioinformatics/btn458. Epub 2008 Aug 27.

Supervised principal component analysis for gene set enrichment of microarray data with continuous or survival outcomes

Affiliations

Supervised principal component analysis for gene set enrichment of microarray data with continuous or survival outcomes

Xi Chen et al. Bioinformatics. .

Abstract

Motivation: Gene set analysis allows formal testing of subtle but coordinated changes in a group of genes, such as those defined by Gene Ontology (GO) or KEGG Pathway databases. We propose a new method for gene set analysis that is based on principal component analysis (PCA) of genes expression values in the gene set. PCA is an effective method for reducing high dimensionality and capture variations in gene expression values. However, one limitation with PCA is that the latent variable identified by the first PC may be unrelated to outcome.

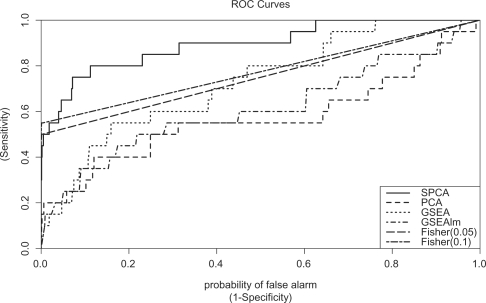
Results: In the proposed supervised PCA (SPCA) model for gene set analysis, the PCs are estimated from a selected subset of genes that are associated with outcome. As outcome information is used in the gene selection step, this method is supervised, thus called the Supervised PCA model. Because of the gene selection step, test statistic in SPCA model can no longer be approximated well using t-distribution. We propose a two-component mixture distribution based on Gumbel exteme value distributions to account for the gene selection step. We show the proposed method compares favorably to currently available gene set analysis methods using simulated and real microarray data.

Software: The R code for the analysis used in this article are available upon request, we are currently working on implementing the proposed method in an R package.


Figures

Fig. 1.
Fig. 1.
Comparison of performances of SPCA, PCA, GSEA and Fisher's exact test using simulated data. This figure shows the ROC for the methods SPCA, PCA, GSEA and Fisher's exact test for scene 4 in Table 1. Fisher (0.05)=Fisher's exact test, using FDR 0.05 as significance cutoff for differential expression of single genes. Fisher (0.1)=Fisher's exact, using FDR 0.1 as significance cutoff for differential expression of single genes. There were 20 simulated datasets, each dataset has 2500 genes assigned to 50 gene sets, among them only the first gene set include genes associated with outcome by design. See text for details of simulation experiment.
Fig. 2.
Fig. 2.
Gene plot for genes in GO category apoptosis from breast cancer dataset. The values on the horizontal axis are gene symbols of genes from apoptosis GO term, values on vertical axis refer to importance score for the genes, or the loadings of first PC score for a given gene. The magnitude and directions of the coefficients represent contributions of each gene to the estimated PC score or the underlying cellular process approximated by the first PC score. Genes playing more important roles in the association between apoptosis and survival outcome have larger magnitude (absolute value) for importance scores.

References

    1. Adragna NC, Lauf PK. K-Cl cotransport function and its potential contribution to cardiovascular disease. Pathophysiology. 2007;14:135–146. - PubMed
    1. Alter O, et al. Singular value decomposition for genome-wide expression data processing and modeling. Proc. Natl Acad. Sci. USA. 2000;97:10101–10106. - PMC - PubMed
    1. Ashburner M, et al. The Gene Ontology consortium. Gene Ontology: tool for the unification of biology. Nat. Genet. 2000;25:25–29. - PMC - PubMed
    1. Backes C, et al. GeneTrail – advanced gene set enrichment analysis. Nucleic Acids Res. 2007;35(Web Server Issue):W186–W192. - PMC - PubMed
    1. Bair E, Tibshirani R. Semi-supervised methods to predict patient survival from gene expression data. PLOS Biol. 2004;2:511–522. - PMC - PubMed

Publication types