. 2008 Nov;82(21):10510-8.
doi: 10.1128/JVI.01419-08. Epub 2008 Aug 27.

Region between the canine distemper virus M and F genes modulates virulence by controlling fusion protein expression

Affiliations

Region between the canine distemper virus M and F genes modulates virulence by controlling fusion protein expression

Danielle E Anderson et al. J Virol. 2008 Nov.

Abstract

Morbilliviruses, including measles and canine distemper virus (CDV), are nonsegmented, negative-stranded RNA viruses that cause severe diseases in humans and animals. The transcriptional units in their genomes are separated by untranslated regions (UTRs), which contain essential transcription and translation signals. Due to its increased length, the region between the matrix (M) protein and fusion (F) protein open reading frames is of particular interest. In measles virus, the entire F 5' region is untranslated, while several start codons are found in most other morbilliviruses, resulting in a long F protein signal peptide (Fsp). To characterize the role of this region in morbillivirus pathogenesis, we constructed recombinant CDVs, in which either the M-F UTR was replaced with that between the nucleocapsid (N) and phosphoprotein (P) genes, or 106 Fsp residues were deleted. The Fsp deletion alone had no effect in vitro and in vivo. In contrast, substitution of the UTR was associated with a slight increase in F gene and protein expression. Animals infected with this virus either recovered completely or experienced prolonged disease and death due to neuroinvasion. The combination of both changes resulted in a virus with strongly increased F gene and protein expression and complete attenuation. Taken together, our results provide evidence that the region between the morbillivirus M and F genes modulates virulence through transcriptional control of the F gene expression.


Figures

FIG. 1.
FIG. 1.
Schematic diagram of the M-F region in the morbillivirus genome. The M-F region extends from the M gene stop codon to the Fsp cleavage site (A↓QIHW residues). The intergenic region is indicated by the position of the CTT triplet, and the locations of in-frame F start codons are marked by arrowheads. The end of the M protein and the beginning of F2 subunit of the mature F protein are black, and the putative Fsp is gray. Measles virus is the type species of the genus Morbillivirus and the Edmonston strain (MeV; GenBank accession no. AF266288) is shown. Canine distemper virus (CDV strain 5804P; GenBank accession no. AY386316), Rinderpest virus (RPV; GenBank accession no. NC_006296), Peste-des-petits-ruminants virus (PRPV; GenBank accession no. NC_006383), Dolphin morbillivirus (DMV; GenBank accession no. NC_005283), and Phocine distemper virus (PDV; GenBank accession no. D10371) are shown below. Genome components are drawn to scale.
FIG. 2.
FIG. 2.
Growth characterization of recombinant CDVs produced in this study. (A) Schematic drawing of different recombinant viruses. The recombinant 5804PeH genome is drawn to scale. Black and white boxes represent open reading frames and UTRs, respectively. The genes are indicated by their corresponding abbreviations. The M-F region of the recombinant viruses is expanded below. The signal peptide coding region of the F gene (Fsp) is shaded gray. (B and C) Growth curves of the parental 5804PeH virus and the three recombinant viruses in VerodogSLAMtag cells expressed as titers of released (B) and cell-associated virus (C). Cells were infected at an MOI of 0.01, and samples were harvested daily for 5 days. Titers are expressed as TCID50. The parental 5804PeH virus is represented by circles, 58utrMF-NP by triangles, 58utrMF-NPΔF106 by squares, and 58ΔF106 by diamonds. Error bars indicate standard deviations. (D) Syncytium formation in VerodogSLAMtag cells. Cells were infected at an MOI of 0.01 and overlaid with 0.5% methylcellulose. Photographs were taken at 72 h postinfection, using phase contrast (top panels) and fluorescence excitation (bottom panels) at a magnification of ×100.
FIG. 3.
FIG. 3.
Virulence of recombinant CDVs in ferrets. (A) A virulence index for the parental and recombinant viruses is shown. Each box represents one animal, and each experimental group contained four to six animals. For the virulence index, black represents the highest score (2), gray represents an intermediate score (1), and white represents the lowest score (0), as specified in Materials and Methods. (B) Survival curve of ferrets infected with the different mutants. Animals were infected with 105 TCID50 intranasally. Death of an infected animal is indicated by a step down on the graph. (C) The course of cell-associated viremia is displayed as the number of CDV-infected cells per million PBMCs. (D) CDV-specific IgG response in serum samples over the course of the disease. An IPMA was performed, and antibody titers are displayed as reciprocals of the highest antibody dilution at which viral antigen was observed. The 5804PeH virus is represented by black circles, 58utrMF-NPΔF106 by gray squares, 58utrMF-NP by black or gray triangles for animals that survived (surv) or died (died), respectively, and 58ΔF106 by black diamonds. Error bars indicate standard deviations.
FIG. 4.
FIG. 4.
Macroscopic visualization of eGFP expression in brain and lungs of an animal that succumbed to infection with 58utrMF-NP virus. The contours of the organs are outlined by a white line. (A and B) Ventral view of the brain at the time of euthanasia (28 d.p.i.). (C and D) Ventral view of the lungs at the time of euthanasia (28 d.p.i.). Organs were photographed using phase contrast (A and C) and fluorescence excitation (B and D).
FIG. 5.
FIG. 5.
Effect of the M-F UTR on viral F transcription. (A and B) Northern blot analysis of viral mRNA with DNA probes. Total RNA (5 μg) extracted from VerodogSLAMtag cells infected with 5804PeH virus and the recombinant viruses 58utrMF-NP, 58utrMF-NPΔF106, and 58ΔF106 was subjected to Northern blot analysis using DIG-labeled probes. Membranes were hybridized with DIG-labeled DNA probes for CDV N (A) or CDV F (B) mRNA. The genome/antigenome and the position of the N and F mRNAs, respectively, are indicated. (C) Relative quantity of F gene transcription. The ratio of F to N gene expression was calculated for each virus from at least six independent experiments. Error bars represent the standard deviations. Statistical analysis was performed using a one-way analysis of variance with Tukey's multiple comparison test, and the asterisk (*) defines statistically different (P < 0.005) samples. Band intensities were determined by densitometry (optical density [OD]) of nonsaturated exposures using Kodak Molecular Imaging software.
FIG. 6.
FIG. 6.
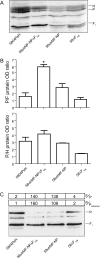
Effect of M-F UTR on F protein translation and incorporation into infectious virions. (A) Western blot analysis of viral F protein. VerodogSLAMtag cells were infected with the 5804PeH, 58utrMF-NP, 58utrMF-NPΔF106, and 58ΔF106 viruses at an MOI of 0.01 and overlaid with 0.5% methylcellulose. Cell lysates were extracted at 72 h postinfection and subjected to Western blot analysis. The membranes were probed with rabbit antipeptide sera specific to the CDV P, F, and H proteins. (B) Normalized F and H protein expression levels. Band intensities of the P, F, and H protein bands were determined by densitometry (optical density [OD]) from nonsaturated exposures, using Kodak Molecular Imaging software. The F and H protein expression levels were normalized by calculating the F/P and H/P ratios for each virus. The graph represents the results from three independent experiments. Error bars indicate the standard deviations. Statistical analysis was performed using a one-way analysis of variance with Tukey's multiple comparison test and the asterisk (*) indicates statistically different (P < 0.005) samples. (C) Western blot analysis of F protein incorporation in infectious virions. VerodogSLAMtag cells were infected with the 5804PeH, 58utrMF-NP, 58utrMF-NPΔF106, and 58ΔF106 viruses, supernatants were collected, and virions were purified by ultracentrifugation through a 20%/60% discontinuous sucrose gradient. Purified virus titers were determined, and 105 TCID50 were loaded in each well. Membranes were probed with rabbit antipeptide sera specific to the CDV P and F proteins. The top panel displays the relative F protein incorporation, expressed as a ratio between the OD values of the P and F protein bands of each virus. The middle panel indicates the relative infectivity, as a ratio between the OD of the P proteins of the respective viruses and that of the parental 5804PeH virus.

References

    1. Barrett, T., and P. B. Rossiter. 1999. Rinderpest: the disease and its impact on humans and animals. Adv. Virus Res. 5389-110. - PubMed
    1. Calain, P., and L. Roux. 1993. The rule of six, a basic feature for efficient replication of Sendai virus defective interfering RNA. J. Virol. 674822-4830. - PMC - PubMed
    1. Cathomen, T., C. J. Buchholz, P. Spielhofer, and R. Cattaneo. 1995. Preferential initiation at the second AUG of the measles virus F mRNA: a role for the long untranslated region. Virology 214628-632. - PubMed
    1. Cosby, S. L., W. P. Duprex, L. A. Hamill, M. Ludlow, and S. McQuaid. 2002. Approaches in the understanding of morbillivirus neurovirulence. J. Neurovirol. 8(Suppl. 2)85-90. - PubMed
    1. Domingo, E., and J. J. Holland. 1997. RNA virus mutations and fitness for survival. Annu. Rev. Microbiol. 51151-178. - PubMed

Publication types

LinkOut - more resources