. 2008 Oct;148(2):1055-67.
doi: 10.1104/pp.108.125237. Epub 2008 Aug 27.

Mitochondrial serine acetyltransferase functions as a pacemaker of cysteine synthesis in plant cells

Affiliations

Mitochondrial serine acetyltransferase functions as a pacemaker of cysteine synthesis in plant cells

Florian H Haas et al. Plant Physiol. 2008 Oct.

Abstract

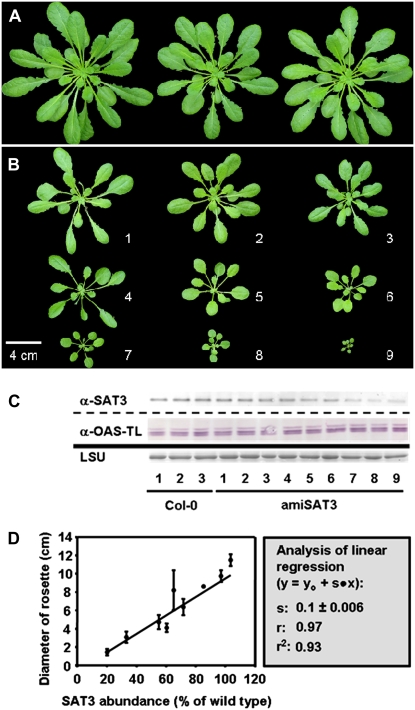
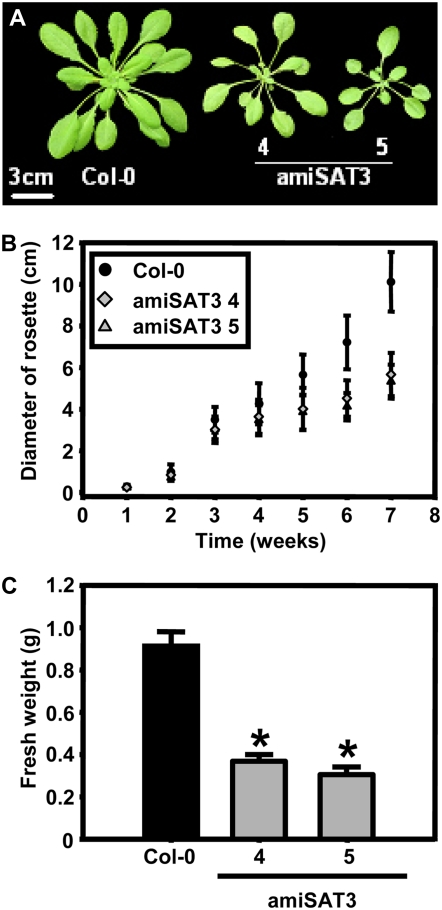
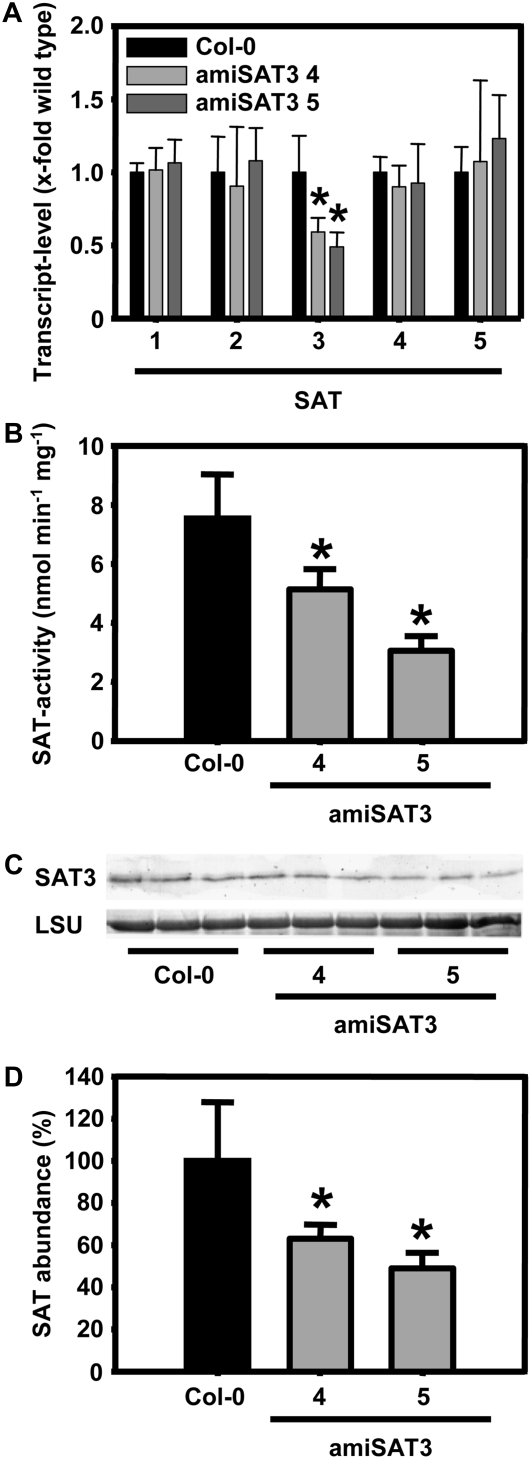
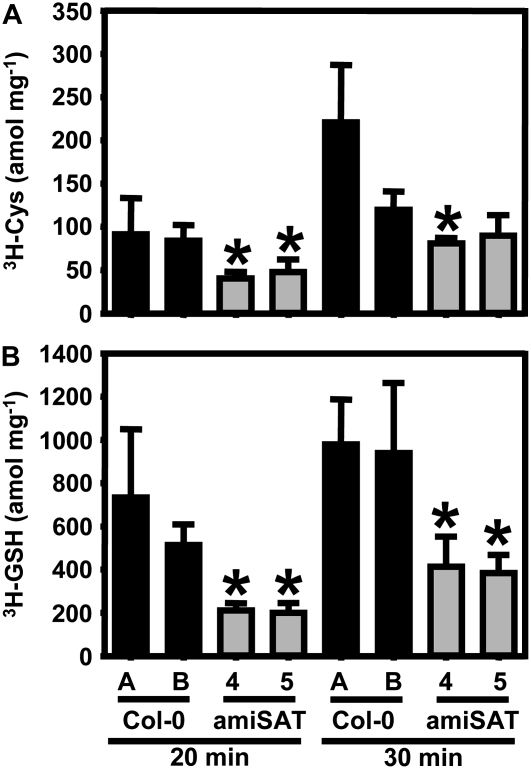
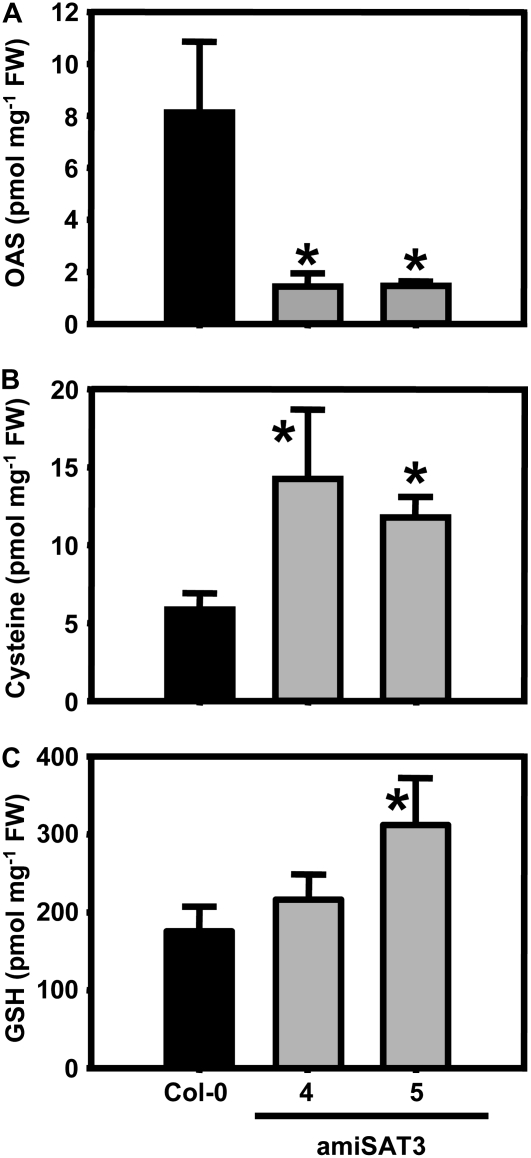
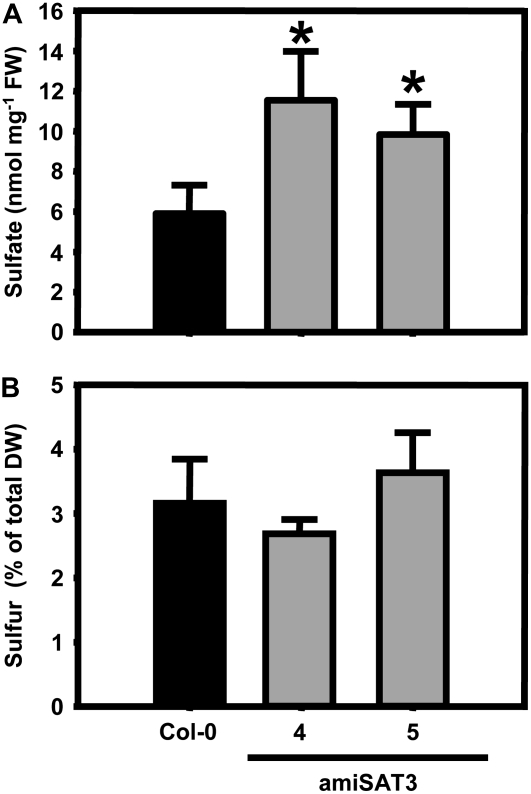
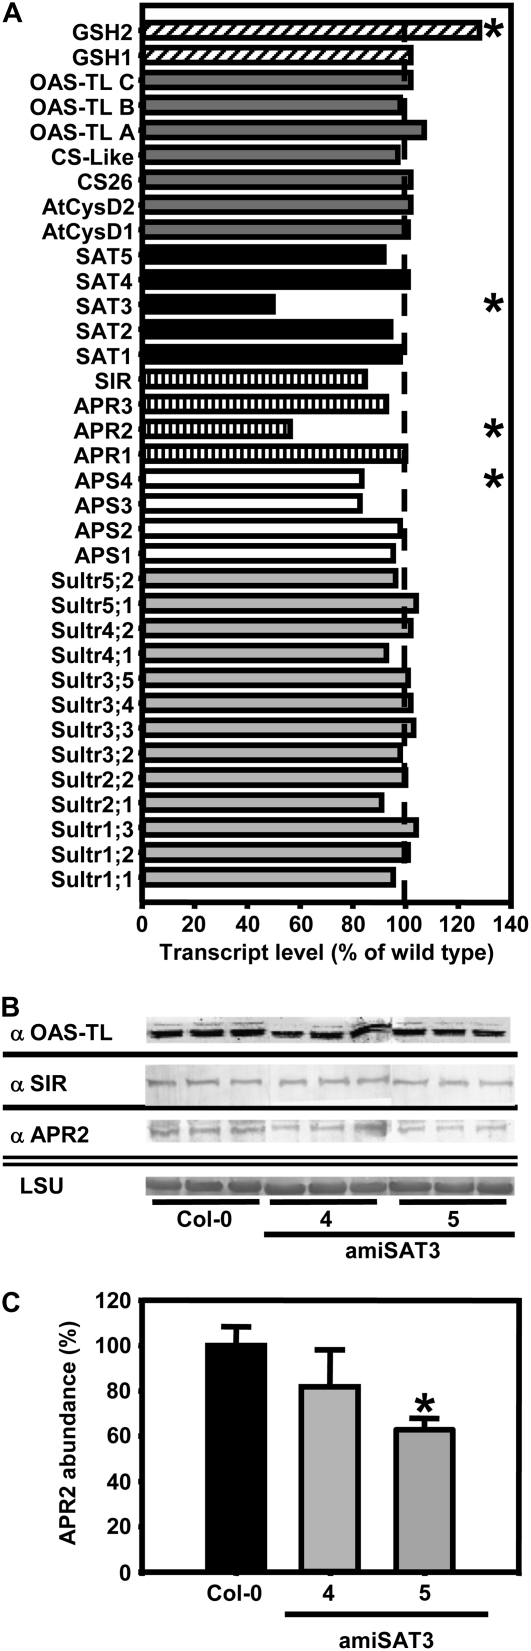
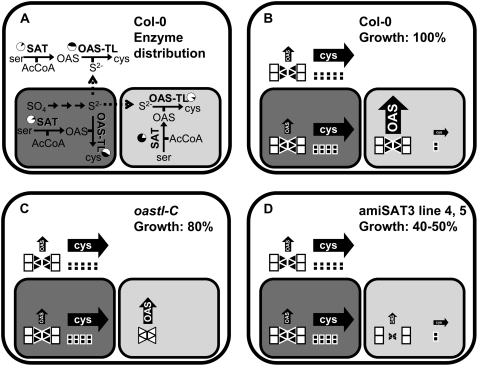
Cysteine (Cys) synthesis in plants is carried out by two sequential reactions catalyzed by the rate-limiting enzyme serine acetyltransferase (SAT) and excess amounts of O-acetylserine(thiol)lyase. Why these reactions occur in plastids, mitochondria, and cytosol of plants remained unclear. Expression of artificial microRNA (amiRNA) against Sat3 encoding mitochondrial SAT3 in transgenic Arabidopsis (Arabidopsis thaliana) plants demonstrates that mitochondria are the most important compartment for the synthesis of O-acetylserine (OAS), the precursor of Cys. Reduction of RNA levels, protein contents, SAT enzymatic activity, and phenotype strongly correlate in independent amiSAT3 lines and cause significantly retarded growth. The expression of the other four Sat genes in the Arabidopsis genome are not affected by amiRNA-SAT3 according to quantitative real-time polymerase chain reaction and microarray analyses. Application of radiolabeled serine to leaf pieces revealed severely reduced incorporation rates into Cys and even more so into glutathione. Accordingly, steady-state levels of OAS are 4-fold reduced. Decrease of sulfate reduction-related genes is accompanied by an accumulation of sulfate in amiSAT3 lines. These results unequivocally show that mitochondria provide the bulk of OAS in the plant cell and are the likely site of flux regulation. Together with recent data, the cytosol appears to be a major site of Cys synthesis, while plastids contribute reduced sulfur as sulfide. Thus, Cys synthesis in plants is significantly different from that in nonphotosynthetic eukaryotes at the cellular level.


Figures

Figure 1.
Figure 1.
Impact of reduced mitochondrial SAT levels on the growth rate of Arabidopsis. A, Wild-type Arabidopsis plants were transformed with pBinAR-amiSAT3 and selected on kanamycin-containing medium. B, After 2 weeks, surviving transgenic plants were transferred to soil for an additional 6 weeks. C, The abundance of mitochondrial SAT3 was measured by immunological detection from soluble Arabidopsis protein extracts (15 μg) using a SAT3-specific antibody (Wirtz and Hell, 2007). The large subunit of ribulose-1,5-bisphosphate carboxylase (LSU) served as a loading control after staining with Coomassie Brilliant Blue. D, At the same time of harvesting the sample for protein extraction, the rosette diameters of the transgenic plants were measured three times for each individual and plotted against the SAT abundance of the corresponding plant. The data were fitted using a linear equation. Error bars indicate sd. [See online article for color version of this figure.]
Figure 2.
Figure 2.
Comparison of growth between wild-type and transgenic Arabidopsis plants with intermediate reduction of mitochondrial SAT. A, Phenotypes of a 7-week-old wild-type plant (Col-0) and two independent transgenic plant lines (amiSAT3 lines 4 and 5) with intermediate reduction of mitochondrial SAT. B, The growth of eight individuals from each genotype was monitored for 7 weeks by determining the diameter of the rosette three times for each individual (n = 24). C, The fresh weights of 8-week-old wild-type plants and the two amiSAT3 lines (n = 4) were determined. Error bars indicate sd, and asterisks mark significant differences using the unpaired t test. [See online article for color version of this figure.]
Figure 3.
Figure 3.
Molecular and biochemical characterization of transgenic Arabidopsis amiSAT3 plants. A, Transcript levels for all members of the SAT gene family in Arabidopsis were determined by quantitative real-time PCR after extraction of total mRNA from leaves of 8-week-old plants (n > 5). Proteins were extracted from three individuals of wild-type plants (black bars) and amiSAT3 plants of lines 4 and 5 (gray bars) of the same age. B, The crude protein extracts (60–100 μg) were tested three times for SAT activity (n = 9). C and D, The abundance of mitochondrial SAT3 was analyzed (n = 9) by immunological detection (C) and quantified by densitometry (D). The large subunit of ribulose-1,5-bisphosphate carboxylase (LSU) served as a loading control after staining with Coomassie Brilliant Blue. Error bars indicate sd, and asterisks mark significant differences using the unpaired t test.
Figure 4.
Figure 4.
Incorporation of Ser into thiols in wild-type and transgenic plants with reduced mitochondrial SAT activity. Eight-week-old transgenic plants with reduced mitochondrial SAT activity (amiSAT3 lines 4 and 5; gray bars) were tested for incorporation of [3H]Ser into Cys and glutathione (GSH). Wild-type plants of the same age (Col-0 A) and of the same developmental stage (Col-0 B; 6 weeks old) as the analyzed amiSAT lines served as controls (black bars). All plants were grown on soil under the same conditions as plants used for analysis of metabolites, transcript levels, and protein abundance. Samples of three individuals of wild-type and transgenic plants were taken and analyzed for incorporation of the radioactive label from [3H]Ser into thiols after 20 and 30 min according to Heeg et al. (2008). Error bars indicate sd, and asterisks mark significant differences from both wild types using the unpaired t test.
Figure 5.
Figure 5.
OAS and thiol contents in leaves of wild-type and transgenic Arabidopsis plants. Rosette leaves of three Arabidopsis wild-type plants (black bars) and three individuals of each independent transgenic plant line with reduced mitochondrial SAT activity (gray bars) were analyzed for OAS (A), Cys (B), and glutathione (GSH; C) after extraction of metabolites with 0.1 m hydrochloric acid. Error bars indicate sd, and asterisks mark significant differences using the unpaired t test. FW, Fresh weight.
Figure 6.
Figure 6.
Sulfate and total sulfur contents in leaves of wild-type and transgenic Arabidopsis plants. A, Rosette leaves of three Arabidopsis wild-type plants (black bars) and three individuals of each independent transgenic plant line with reduced mitochondrial SAT activity (gray bars) were analyzed for sulfate contents. FW, Fresh weight. B, The total sulfur content in dried rosette leaves of 8-week-old wild-type plants (black bars) and the amiSAT3 lines 4 and 5 (gray bars) was analyzed using an elemental analyzer (n = 4). Error bars indicate sd, and asterisks mark significant differences using the unpaired t test. DW, Dry weight.
Figure 7.
Figure 7.
Protein abundances and transcript levels of sulfur metabolism-related genes in leaves of transgenic Arabidopsis plants. A, The transcript levels of sulfur metabolism-related genes in leaves of amiSAT3 line 5 and wild-type Arabidopsis plants were compared using a targeted microarray approach. Total mRNA was extracted form three individuals of each plant line, labeled independently two times with Cy3 and Cy5, and cohybridized with the microarray two times (n = 11). The transcript levels of sulfate transporters (gray bars), ATP-sulfurylases (white bars), sulfate-reducing genes (dashed bars), SATs (black bars), OAS-TLs (dark gray bars), and genes participating in glutathione (GSH) synthesis (inclined dashed bars) in amiSAT3 line 5 are shown as percentages of wild-type levels. B, Proteins were extracted from three individuals of wild-type plants and amiSAT3 lines 4 and 5 of the same age. The abundances of OAS-TL A, B, and C, SIR, and APR2 were determined by immunoblotting using specific antibodies from crude extracts (15 μg). The large subunit of ribulose-1,5-bisphosphate carboxylase (LSU) served as a loading control after staining with Coomassie Brilliant Blue. C, The reduction of APR2 protein in amiSAT3 lines 4 and 5 (gray bars) in comparison with wild-type plants (black bars) was quantified densitometrically. Error bars indicate sd, and asterisks mark significant differences using the unpaired t test.
Figure 8.
Figure 8.
Organization of Cys biosynthesis pathways in plant cells and transgenic Arabidopsis plants with reduced mitochondrial SAT activity. A, Schematic overview of enzymatic activities and metabolites involved in synthesis of Cys in the cytosol (white panel), the mitochondrion (light gray panel), and the chloroplast (dark gray panel). Enzymes are indicated in boldface letters. Black fields of pie charts show the ratio of enzymatic activities present inside the respective compartment as percentages of total extractable activity calculated from subcellular fractionation experiments with pea and spinach leaves (Droux, 2004). Full arrows represent enzymatic reactions, while dashed arrows indicate transport of metabolites across membranes. B, Relative fluxes of OAS and Cys (indicated by the sizes of filled arrows) in different subcellular compartments as deduced from the enzymatic activities of SAT and OAS-TL. Most likely, hexameric SAT (triangles) is associated with two OAS-TL dimers (cubes) to form the CSC. Black filling of triangles and cubes indicates the active form of enzyme, while white filling indicates inactivated or less active enzyme. The impacts on growth rate and subcellular fluxes of metabolites as a consequence of disturbed CSC formation in the mitochondria of OAS-TL C knockout plants (oastlC) and specific down-regulation of mitochondrial SAT activity in amiSAT3 plants are shown in C and D, respectively. The sizes of triangles in C and D represent the amount of SAT with respect to the wild-type level (B).

References

    1. Berkowitz O, Wirtz M, Wolf A, Kuhlmann J, Hell R (2002) Use of biomolecular interaction analysis to elucidate the regulatory mechanism of the cysteine synthase complex from Arabidopsis thaliana. J Biol Chem 277 30629–30634 - PubMed
    1. Blaszczyk A, Brodzik R, Sirko A (1999) Increased resistance to oxidative stress in transgenic tobacco plants overexpressing bacterial serine acetyltransferase. Plant J 20 237–243 - PubMed
    1. Bogdanova N, Bork C, Hell R (1995) Cysteine biosynthesis in plants: isolation and functional identification of a cDNA encoding a serine acetyltransferase from Arabidopsis thaliana. FEBS Lett 358 43–47 - PubMed
    1. Bogdanova N, Hell R (1997) Cysteine synthesis in plants: protein-protein interactions of serine acetyltransferase from Arabidopsis thaliana. Plant J 11 251–262 - PubMed
    1. Bradford MM (1976) A rapid and sensitive method for the quantitation of microgram quantities of protein utilizing the principle of protein-dye binding. Anal Biochem 72 248–254 - PubMed

Publication types

MeSH terms