. 2008 Nov;41(5):315-28.
doi: 10.1677/JME-08-0062. Epub 2008 Aug 27.

Foxa2 and MafA regulate islet-specific glucose-6-phosphatase catalytic subunit-related protein gene expression

Affiliations

Foxa2 and MafA regulate islet-specific glucose-6-phosphatase catalytic subunit-related protein gene expression

Cyrus C Martin et al. J Mol Endocrinol. 2008 Nov.

Abstract

Islet-specific glucose-6-phosphatase catalytic subunit-related protein (IGRP/G6PC2) is a major autoantigen in both mouse and human type 1 diabetes. IGRP is selectively expressed in islet beta cells and polymorphisms in the IGRP gene have recently been associated with variations in fasting blood glucose levels and cardiovascular-associated mortality in humans. Chromatin immunoprecipitation (ChIP) assays have shown that the IGRP promoter binds the islet-enriched transcription factors Pax-6 and BETA2. We show here, again using ChIP assays, that the IGRP promoter also binds the islet-enriched transcription factors MafA and Foxa2. Single binding sites for these factors were identified in the proximal IGRP promoter, mutation of which resulted in decreased IGRP fusion gene expression in betaTC-3, Hamster insulinoma tumor (HIT), and Min6 cells. ChiP assays have shown that the islet-enriched transcription factor Pdx-1 also binds the IGRP promoter, but mutational analysis of four Pdx-1 binding sites in the proximal IGRP promoter revealed surprisingly little effect of Pdx-1 binding on IGRP fusion gene expression in betaTC-3 cells. In contrast, in both HIT and Min6 cells mutation of these four Pdx-1 binding sites resulted in a approximately 50% reduction in fusion gene expression. These data suggest that the same group of islet-enriched transcription factors, namely Pdx-1, Pax-6, MafA, BETA2, and Foxa2, directly or indirectly regulate expression of the two major autoantigens in type 1 diabetes.


Figures

Figure 1
Figure 1. MafA and Pdx-1 bind the−186/−157 IGRP promoter region in vitro
βTC-3 nuclear extract was incubated in the absence (−) or presence of the indicated anti-serum for 10 minutes on ice. A labeled oligonucleotide representing the wild-type −186/−157 IGRP promoter region (Maf WT; Table 1) was then added and incubation continued for 20 min at room temperature. Protein binding was then analyzed using the gel retardation assay as described in Materials and Methods. In the representative audioradiograph shown, only the retarded complexes are visible and not the free probe, which was present in excess.
Figure 2
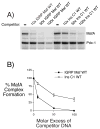
Figure 2. Comparison of MafA binding to the−186/−157 IGRP promoter region and rat insulin II promoter C1 element in vitro
Panel A: A labeled oligonucleotide representing the wild-type −186/−157 IGRP promoter region (IGRP Maf WT; Table 1) was incubated in the absence (−) or presence of the indicated molar excess of the unlabeled IGRP MafA WT or Ins C1 WT oligonucleotide (Table 1) competitors prior to the addition of βTC-3 cell nuclear extract. Protein binding was then analyzed using the gel retardation assay as described in Materials and Methods. In the representative autoradiograph shown only the retarded complexes are visible and not the free probe, which was present in excess. The MafA and Pdx-1 complexes are indicated (see Fig. 1). Panel B: Protein binding was quantified by using a Packard Instant Imager to count 32P associated with the retarded complex. The data represents the mean + S.E.M. of three experiments.
Figure 3
Figure 3. Identification of a mutation that selectively disrupts MafA and not Pdx-1 binding
A labeled oligonucleotide representing the wild-type −186/−157 IGRP promoter region (IGRP Maf WT) was incubated in the absence or presence of a 100-fold molar excess of the unlabeled IGRP Maf WT or IGRP Maf MUT (Table 1) competitors. βTC-3 nuclear extract was then added and protein binding was analyzed using the gel retardation assay as described in Materials and Methods. In the representative audioradiograph shown, only the retarded complexes are visible and not the free probe, which was present in excess. The MafA and Pdx-1 complexes are indicated (see Fig. 1).
Figure 4
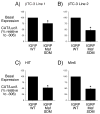
Figure 4. Disruption of MafA binding reduces IGRP promoter activity
Two separate batches of βTC-3 cells (Panels A & B), HIT cells (Panel C) and Min6 cells (Panel D) were transiently co-transfected, as described in Materials and Methods, using a lipofectamine solution containing various IGRP-CAT fusion genes (2 μg) and an expression vector encoding firefly luciferase (0.5 μg). The IGRP-CAT fusion genes represented either the wild-type promoter sequence, located between −306 and +3 (IGRP WT), or the same sequence with a site-directed mutation (SDM) in the Maf A binding site (IGRP Maf SDM). The mutation was identical to that used in the gel retardation analysis (Panel A). Following transfection, cells were incubated for 18–20 hr in serum-containing medium. The cells were then harvested and both CAT and luciferase activity was assayed as described in Materials and Methods. Results are presented as the ratio of CAT:firefly luciferase activity, expressed as a percentage relative to the value obtained with the IGRP WT fusion gene, and represent the mean of 3 experiments ± S.E.M., each using an independent preparation of each fusion gene plasmid, assayed in triplicate. *, p < 0.05 versus IGRP WT.
Figure 5
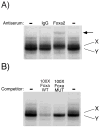
Figure 5. Foxa2 binds the−246/−221 IGRP promoter region in vitro
Panel A: βTC-3 nuclear extract was incubated in the absence (−) or presence of the indicated anti-serum for 10 minutes on ice. A labeled oligonucleotide representing the wild-type −246/−221 IGRP promoter region (IGRP Foxa WT; Table 1) was then added and incubation continued for 20 min at room temperature. Protein binding was then analyzed using the gel retardation assay as described in Materials and Methods. In the representative audioradiograph shown, only the retarded complexes are visible and not the free probe, which was present in excess. The two major complexes detected were designated X and Y. The arrow indicates a supershifted complex. Panel B: The labeled oligonucleotide representing the wild-type −246/−221 IGRP promoter region (IGRP Foxa WT) was incubated in the absence or presence of a 100-fold molar excess of the unlabeled IGRP Foxa WT or IGRP Foxa MUT (Table 1) competitors. βTC-3 nuclear extract was then added and protein binding was analyzed using the gel retardation assay as described in Materials and Methods. In the representative audioradiograph shown, only the retarded complexes are visible and not the free probe, which was present in excess.
Figure 6
Figure 6. Disruption of Foxa2 binding reduces IGRP promoter activity
Two separate batches of βTC-3 cells (Panels A & B), HIT cells (Panel C) and Min6 cells (Panel D) were transiently co-transfected, as described in Materials and Methods, using a lipofectamine solution containing various IGRP-CAT fusion genes (2 μg) and an expression vector encoding firefly luciferase (0.5 μg). The IGRP-CAT fusion genes represented either the wild-type promoter sequence, located between −306 and +3 (IGRP WT), or the same sequence with a site-directed mutation (SDM) in the Foxa2 binding site (IGRP Foxa SDM). The mutation was identical to that used in the gel retardation analysis (Fig. 4B). Following transfection, cells were incubated for 18–20 hr in serum-containing medium. The cells were then harvested and both CAT and luciferase activity was assayed as described in Materials and Methods. Results are presented as the ratio of CAT:firefly luciferase activity, expressed as a percentage relative to the value obtained with the −306 WT fusion gene, and represent the mean of 3 experiments ± S.E.M., each using an independent preparation of each fusion gene plasmid, assayed in triplicate. *, p < 0.05 versus IGRP WT.
Figure 7
Figure 7. The IGRP promoter binds Foxa2 and a Maf family member in situ
Foxa2 and Maf binding to the IGRP promoter were analyzed in situ using the chromatin immunoprecipitation (ChIP) assay. Chromatin from formaldehyde-treated βTC-3 cells was immunoprecipitated using anti-Foxa2 or anti-c-Maf antibodies or, as a control, using IgG. The presence of the IGRP promoter and exon 5 in the chromatin preparation prior to immunoprecipitation (1:100 input) and in the immunoprecipitates was then assayed using PCR as described in Materials and Methods. The autoradiograph shown is representative of 3 different experiments. Both the IGRP promoter and exon 5 are amplified with similar efficiencies in the chromatin preparation (Martin et al. 2003). MW; molecular weight.
Figure 8
Figure 8. Disruption of Foxa2 binding reduces IGRP promoter activity in HIT and Min6 but not βTC-3 cells
βTC-3 cells (Panel A), HIT cells (Panel B) and Min6 cells (Panel C) were transiently co-transfected, as described in Materials and Methods, using a lipofectamine solution containing various IGRP-CAT fusion genes (2 μg) and an expression vector encoding firefly luciferase (0.5 μg). The IGRP-CAT fusion genes represented either the wild-type promoter sequence, located between −306 and +3 (IGRP WT), or the same sequence with a site-directed mutation (SDM) in the four Pdx-1 binding sites (IGRP Quad SDM). Following transfection, cells were incubated for 18–20 hr in serum-containing medium. The cells were then harvested and both CAT and luciferase activity was assayed as described in Materials and Methods. Results are presented as the ratio of CAT:firefly luciferase activity, expressed as a percentage relative to the value obtained with the −306 WT fusion gene, and represent the mean of 3 experiments ± S.E.M., each using an independent preparation of each fusion gene plasmid, assayed in triplicate. *, p < 0.05 versus IGRP WT.
Figure 9
Figure 9. Islet-enriched transcription factors synergistically activate IGRP fusion gene transcription in HeLa cells
HeLa cells were transiently co-transfected, as described in Materials and Methods, using a lipofectamine solution containing the −306/+3 IGRP-CAT fusion gene (2 μg) and expression vectors (0.1 μg each) encoding the indicated transcription factors or the matching empty vector pCMV4/pcDNA3 controls. Panel A shows the effect of adding individual factors whereas Panel B shows the effect of removing individual factors. Following transfection, cells were incubated for 18–20 hr in serum-free medium. The cells were then harvested and both CAT activity and the protein concentration of the cell lysate were assayed as described in Materials and Methods. Results are presented as the ratio of CAT activities, corrected for the protein concentration in the cell lysate, relative to that obtained in the presence of all factors, expressed as a percentage, and represent the mean ± S.E.M. of three experiments, each using an independent preparation of the fusion gene plasmid with each condition assayed in triplicate.
Figure 10
Figure 10. Pdx-1 does not directly regulate IGRP fusion gene expression in HeLa cells
HeLa cells were transiently co-transfected, as described in Fig. 8, with various IGRP-CAT fusion genes (2 μg) and expression vectors (0.1 μg) encoding Pax-6, MafA, BETA2 and E47 and either pCMV4-Pdx-1 (+ All) or pCMV4 alone (−Pdx-1). The IGRP-CAT fusion genes represented either the wild-type (WT) promoter sequence, located between −306 and +3, or the same sequence with site-directed mutation (SDM) in the four Pdx-1 binding sites (Quad SDM). Following transfection, cells were incubated for 18–20 hr in serum-free medium. The cells were then harvested and both CAT activity and the protein concentration of the cell lysate were assayed as described in Materials and Methods. Results are presented as the ratio of CAT activities, corrected for the protein concentration in the cell lysate, relative to that obtained with the WT fusion gene in the presence of all factors, expressed as a percentage, and represent the mean ± S.E.M. of three experiments, each using an independent preparation of each fusion gene plasmids, with each condition assayed in triplicate.

Similar articles

Cited by

References

    1. Ang SL, Rossant J. HNF-3 beta is essential for node and notochord formation in mouse development. Cell. 1994;78:561–574. - PubMed
    1. Aramata S, Han SI, Kataoka K. Roles and regulation of transcription factor MafA in islet beta-cells. Endocr J. 2007;54:659–666. - PubMed
    1. Arden SD, Zahn T, Steegers S, Webb S, Bergman B, O’Brien RM, Hutton JC. Molecular cloning of a pancreatic islet-specific glucose-6-phosphatase catalytic subunit-related protein. Diabetes. 1999;48:531–542. - PubMed
    1. Artner I, Blanchi B, Raum JC, Guo M, Kaneko T, Cordes S, Sieweke M, Stein R. MafB is required for islet beta cell maturation. Proc Natl Acad Sci U S A. 2007;104:3853–3858. - PMC - PubMed
    1. Bischof LJ, Martin CC, Svitek CA, Stadelmaier BT, Hornbuckle LA, Goldman JK, Oeser JK, Hutton JC, O’Brien RM. Characterization of the Mouse Islet-Specific Glucose-6-Phosphatase Catalytic Subunit-Related Protein Gene Promoter by In Situ Footprinting. Correlation with Fusion Gene Expression in the Islet Derived bTC-3 and Hamster Insulinoma Tumor Cell Lines. Diabetes. 2001;50:502–514. - PubMed

Publication types

MeSH terms

LinkOut - more resources