. 2008 Oct;100(4):2381-96.
doi: 10.1152/jn.90393.2008. Epub 2008 Aug 27.

Low-frequency envelope sensitivity produces asymmetric binaural tuning curves

Affiliations

Low-frequency envelope sensitivity produces asymmetric binaural tuning curves

John P Agapiou et al. J Neurophysiol. 2008 Oct.

Abstract

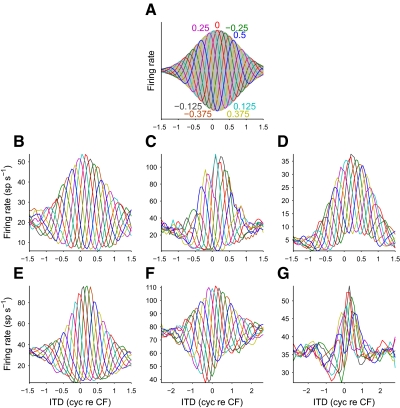
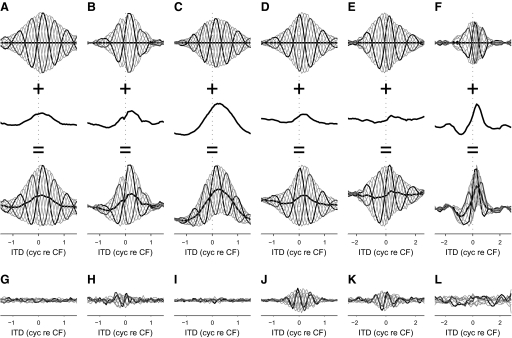
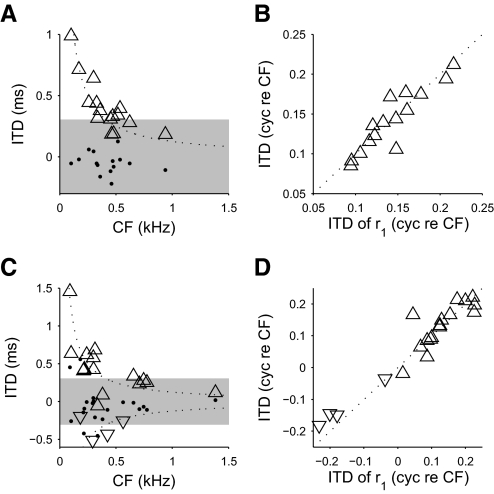
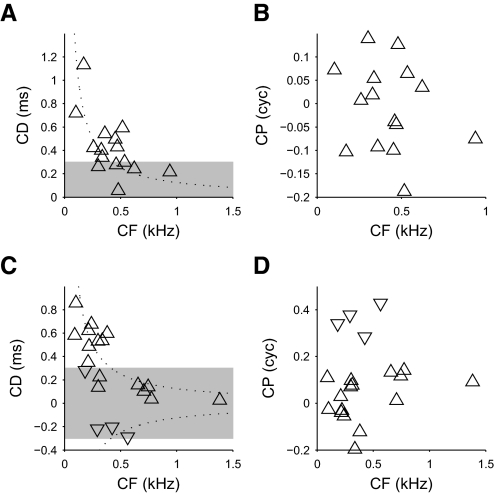
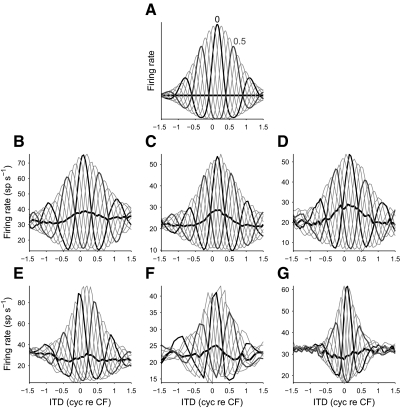
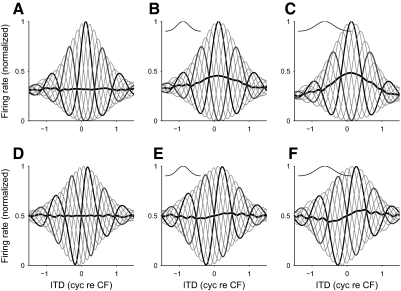
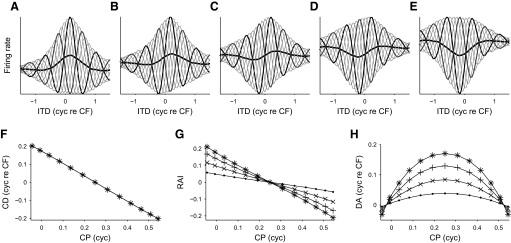
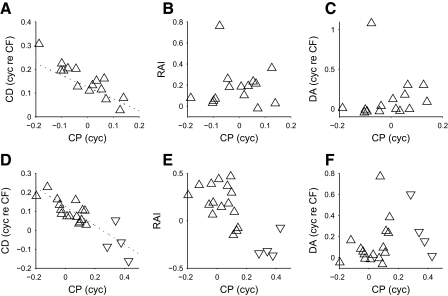
Neurons in the auditory midbrain are sensitive to differences in the timing of sounds at the two ears--an important sound localization cue. We used broadband noise stimuli to investigate the interaural-delay sensitivity of low-frequency neurons in two midbrain nuclei: the inferior colliculus (IC) and the dorsal nucleus of the lateral lemniscus. Noise-delay functions showed asymmetries not predicted from a linear dependence on interaural correlation: a stretching along the firing-rate dimension (rate asymmetry), and a skewing along the interaural-delay dimension (delay asymmetry). These asymmetries were produced by an envelope-sensitive component to the response that could not entirely be accounted for by monaural or binaural nonlinearities, instead indicating an enhancement of envelope sensitivity at or after the level of the superior olivary complex. In IC, the skew-like asymmetry was consistent with intermediate-type responses produced by the convergence of ipsilateral peak-type inputs and contralateral trough-type inputs. This suggests a stereotyped pattern of input to the IC. In the course of this analysis, we were also able to determine the contribution of time and phase components to neurons' internal delays. These findings have important consequences for the neural representation of interaural timing differences and interaural correlation-cues critical to the perception of acoustic space.


Figures

FIG. 1.
FIG. 1.
Noise-delay functions. A: an example of a noise-delay function predicted from the cross-correlation of narrowband-filtered stimuli. The response takes the form of a family of phase-delayed interaural time difference (ITD) functions; colored numbers indicate the interaural phase disparity (IPD, in cycles) for which the corresponding curve was predicted. The family of ITD functions tile an area (shaded) constrained by upper and lower bounds. Note that the upper and lower bounds are mirror images: modulated to the same depth and centered on the same ITD. BG: noise-delay functions recorded from the dorsal nucleus of the lateral lemniscus (DNLL, BD) and the inferior colliculus (IC, EG). In contrast to the predicted responses (A), the bounds were asymmetric: upper and lower bounds were often different depths (BE and G) and often centered on different delays (CD and FG). Characteristic frequencies were: B, 623 Hz; C, 337 Hz; D, 939 Hz; E, 337 Hz; F, 775 Hz; and G, 313 Hz. For ease of viewing, responses have been smoothed (over ITD) by a 3-point moving-average filter.
FIG. 2.
FIG. 2.
The degree of rate (A) and delay (B) asymmetry for noise-delay functions in DNLL (circles) and IC (pluses).
FIG. 3.
FIG. 3.
Fourier decomposition of a noise-delay function. The original noise-delay function (A) can be decomposed into several components (BD) on the basis of the Fourier transform of the constituent IPD functions. For example, the responses to the 8 IPDs presented at zero ITD form a periodic function (E). Taking the Fourier decomposition of this yields several components: a DC offset (F), a fundamental (G), and a series of harmonics (of which only the second harmonic is shown, H). Each of these Fourier components is used to determine the IPD function at zero ITD in the corresponding noise-delay function component (BD). Repeating this for the whole range of ITDs yields the complete components. Note that since the DC component is not modulated by IPD, the r0(τ) component (B) will not show any IPD dependence. The data shown here are from a DNLL neuron with a characteristic frequency (CF) of 536 Hz.
FIG. 4.
FIG. 4.
The contribution of distortion components to the asymmetry. The asymmetry measures of the original noise-delay functions are plotted on the abscissas; the asymmetry measures of approximations of these noise-delay functions are plotted on the ordinates. In both DNLL (circles) and IC (pluses), removing the r2(τ, φ) and higher components from noise-delay functions produced little change in either the rate asymmetry (A) or the delay asymmetry (B). Removing the IPD-insensitive r0(τ) component, however, produced responses that were both rate symmetric (C) and delay symmetric (D).
FIG. 5.
FIG. 5.
AF: the creation of rate and delay asymmetry by an IPD-insensitive component. Bottom row: approximations of the noise-delay functions in Fig. 1, BG, formed from the sum of the r1(τ, φ) components (top row) and the r0(τ) components (middle row). GL: the residuals after subtracting the approximations in AF from the original noise-delay functions (Fig. 1, BG). Responses obtained at 0 cyc IPD (black) and 0.5 cyc IPD (dark gray) are highlighted; those at all other IPDs are shown in light gray. Equivalence contours are also shown (thick black lines). All components were smoothed (over ITD) by a 3-point moving-average filter for ease of viewing.
FIG. 6.
FIG. 6.
Best ITDs in DNLL and IC. A and C: best ITDs (upward triangles) of peak-type responses in DNLL (A) and IC (C). For trough-type responses, the worst ITDs are shown (downward triangles). The ITDs where first derivatives of the noise-delay functions (recorded at 0 cyc IPD) were maximal (most positive) are also shown (dots). Whereas the best ITDs were largely outside the physiological range (shaded area, ±300 μs; Sterbing et al. 2003), the ITDs of maximum slope were largely inside the physiological range. The dotted lines show the ITDs corresponding to ±1/8 cyc re CF. B and D: the best/worst ITDs of noise-delay functions (ordinates) plotted against the best/worst ITDs of the r1(τ, φ) component (abscissas) for DNLL (B) and IC (D). The best/worst ITDs of the noise-delay function were determined by the best/worst ITDs of the r1(τ, φ) components.
FIG. 7.
FIG. 7.
Time and phase contributions to the internal delay. A and C: the characteristic delay as a function of CF for both peak-type responses (upward triangles) and trough-type responses (downward triangles) in DNLL (A) and IC (C). The dotted lines show the characteristic delays (CDs) corresponding to ±1/8 cyc re CF and the shaded area shows the physiological range for the guinea pig (±300 μs). B and D: the characteristic phase (CP) as a function of CF for DNLL (B) and IC (D). CDs resemble the plots for best ITD (Fig. 6, A and C), whereas CPs are distributed around zero and have no systematic relationship with CF.
FIG. 8.
FIG. 8.
Equivalence contours of noise-delay functions. A: a rate-asymmetric noise-delay function simulated by passing the response in Fig. 1A through a quadratic nonlinearity. The nonlinearity produces positive rate asymmetry but no delay asymmetry. Responses obtained at 0 cyc IPD (black) and 0.5 cyc IPD (dark gray) are highlighted; those at all other IPDs are shown in light gray. The equivalence contour (thick black line), which describes the firing rate where antiphasic ITD-tuning curves intersect, is flat. BG: rate-asymmetric responses recorded from the DNLL (BD) and the IC (EG). In contrast to the flat equivalence contour predicted from a nonlinear dependence on interaural correlation (A), the equivalence contours all showed significant ITD dependence (P ≤ 0.05, Wald–Wolfowitz runs test applied to the sign of the deviation from the median). CFs were: B, 460 Hz; C, 470 Hz; D, 623 Hz; E, 337 Hz; F, 215 Hz; and G, 210 Hz. For ease of viewing, responses were smoothed (over ITD) by a 3-point moving-average filter.
FIG. 9.
FIG. 9.
Effect of peripheral nonlinearities. A: a noise-delay function simulated by cross-correlating half-wave rectified inputs. Similar to the response modeled by a post-MSO nonlinearity (Fig. 8A) there is clear rate asymmetry but the equivalence contour appears flat. B and C: the noise-delay function in A, low-pass filtered by smoothing with a Gaussian (inset). With smoothing the rate asymmetry persisted and the equivalence contour became elevated. D: a delay-asymmetric noise-delay function constructed from the convergence of peak- and trough-type inputs of the form in A. Again, note the flat equivalence contour. E and F: delay-asymmetric functions formed as in D, only with additional low-pass filtering (as for B and C). With smoothing the delay-asymmetry persisted but the equivalence contour became modulated. The CF of the model was 500 Hz and the full widths at half height of the Gaussian kernels were: B and E, 0.4 cyc re CF; C and F, 0.6 cyc re CF. All responses (including insets) have been normalized to facilitate comparison.
FIG. 10.
FIG. 10.
Convergence of peak-type and trough-type responses. AE: responses formed from the weighted sum of a peak-type input tuned to positive ITDs (A) and a trough-type input tuned to negative ITDs (E). Peak-type to trough-type mixture ratios were: A, 0%; B, 25%; C, 50%; D, 75%; E, 100%. The variance explained by the r0(τ) component was 8%. F: the relationship between the CP of the modeled responses and their CD. G and H: the relationship between the CP of the modeled responses and their rate asymmetry (G) and their delay asymmetry (H). The variance explained by the r0(τ) component was either 1% (points), 4% (pluses), 8% (crosses), or 12% (asterisks). These data points lay on top of each other in F.
FIG. 11.
FIG. 11.
Testing the model of convergence. The CD and CP are negatively correlated in both DNLL (A) and IC (D), matching the relationship predicted in Fig. 10F. The dotted line indicates the relationship y = 1/8 − x/2, which corresponds to a linear shift from a stereotypical peak-type neuron (CD = 1/8 cyc re CF, CP = 0 cyc) to a stereotypical trough-type neuron (CD = −1/8 cyc re CF, CP = 0.5 cyc). In DNLL, the CP is not correlated with the rate asymmetry (B) or the delay asymmetry (C). However, in IC, the CP is negatively correlated with the rate asymmetry index (RAI, E) and the delay asymmetry appears to show a dependence on the squared sine of the CP (F). This is a close match to the relationships shown in Fig. 10, G and H. Both peak-type responses (upward triangles) and trough-type responses (downward triangles) are shown.

Similar articles

Cited by

References

    1. Adams JC, Mugnaini E. Dorsal nucleus of the lateral lemniscus: a nucleus of GABAergic projection neurons. Brain Res Bull 13: 585–590, 1984. - PubMed
    1. Albeck Y, Konishi M. Responses of neurons in the auditory pathway of the barn owl to partially correlated binaural signals. J Neurophysiol 74: 1689–1700, 1995. - PubMed
    1. Batra R, Kuwada S, Fitzpatrick DC. Sensitivity to interaural temporal disparities of low- and high-frequency neurons in the superior olivary complex. I. Heterogeneity of responses. J Neurophysiol 78: 1222–1236, 1997. - PubMed
    1. Batra R, Kuwada S, Stanford TR. High-frequency neurons in the inferior colliculus that are sensitive to interaural delays of amplitude-modulated tones: evidence for dual binaural influences. J Neurophysiol 70: 64–80, 1993. - PubMed
    1. Bernstein LR, Trahiotis C. Lateralization of low-frequency, complex waveforms: the use of envelope-based temporal disparities. J Acoust Soc Am 77: 1868–1880, 1985. - PubMed

Publication types

LinkOut - more resources