. 2008 Aug 27;28(35):8709-23.
doi: 10.1523/JNEUROSCI.2077-08.2008.

Genetic dissection of the role of catechol-O-methyltransferase in cognition and stress reactivity in mice

Affiliations

Genetic dissection of the role of catechol-O-methyltransferase in cognition and stress reactivity in mice

Francesco Papaleo et al. J Neurosci. .

Abstract

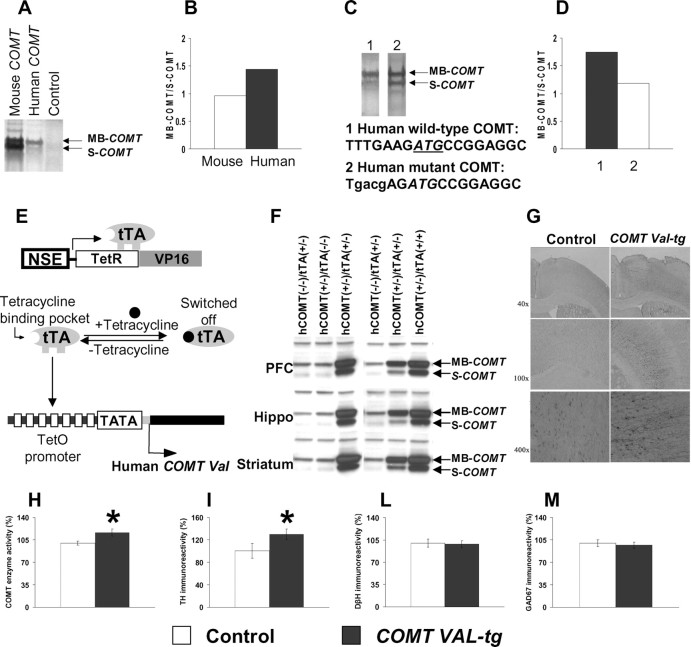
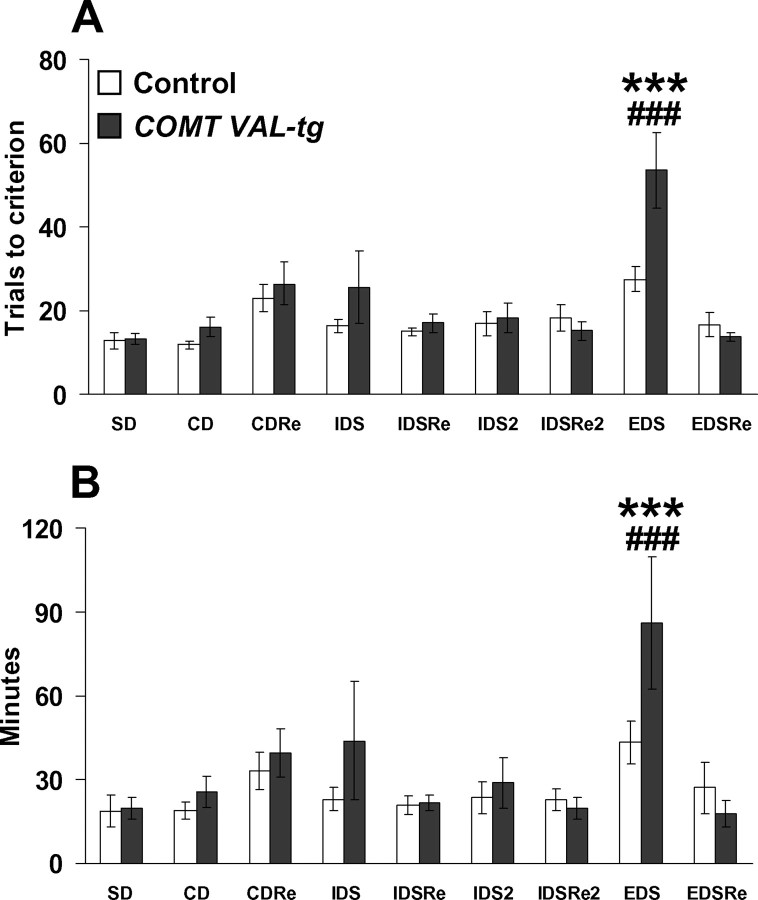
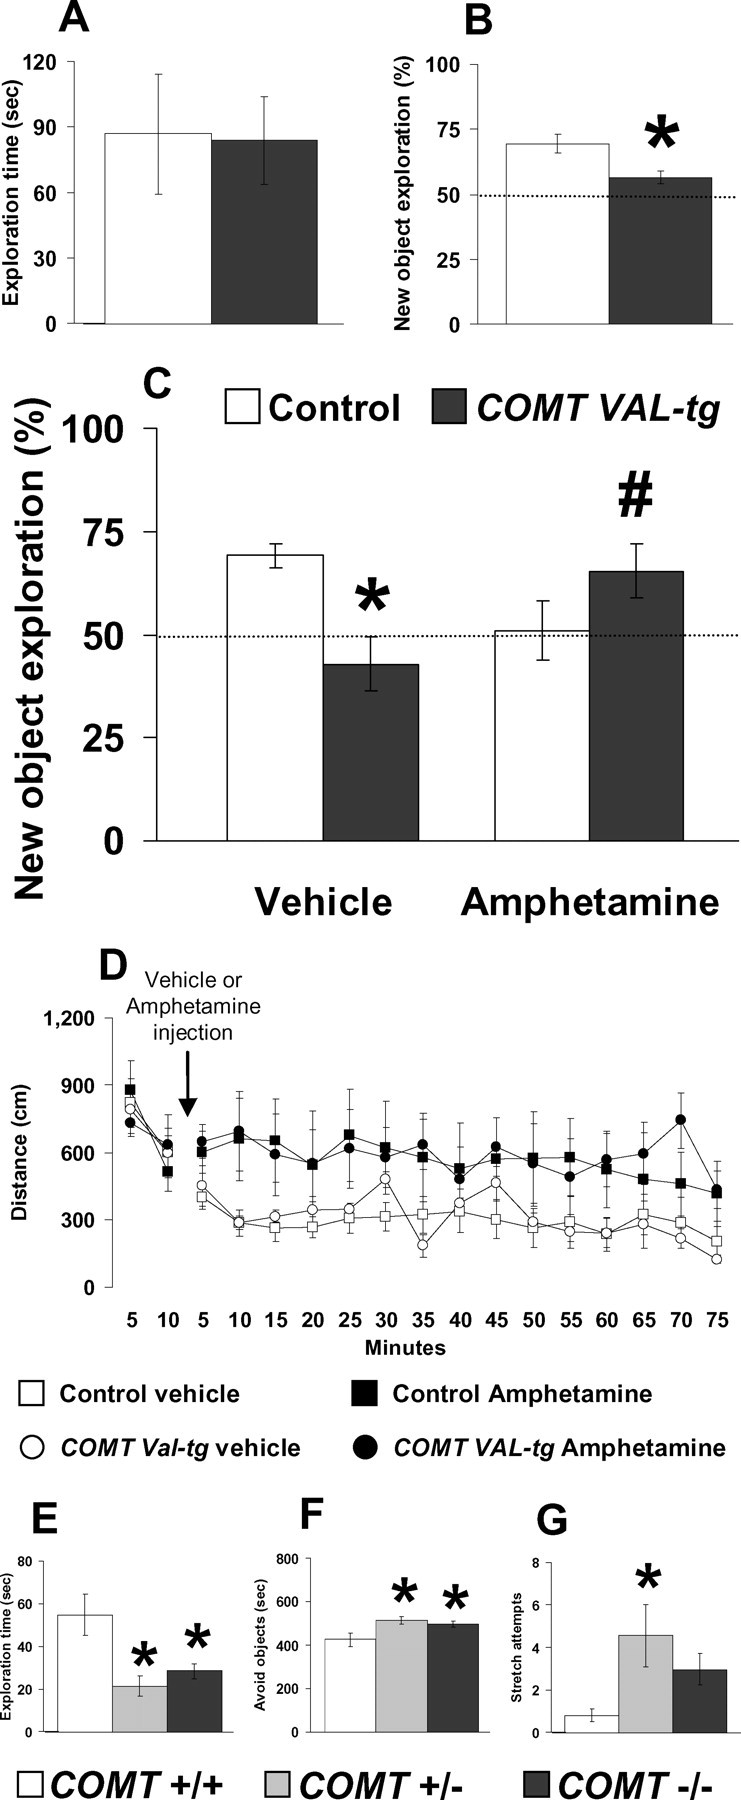
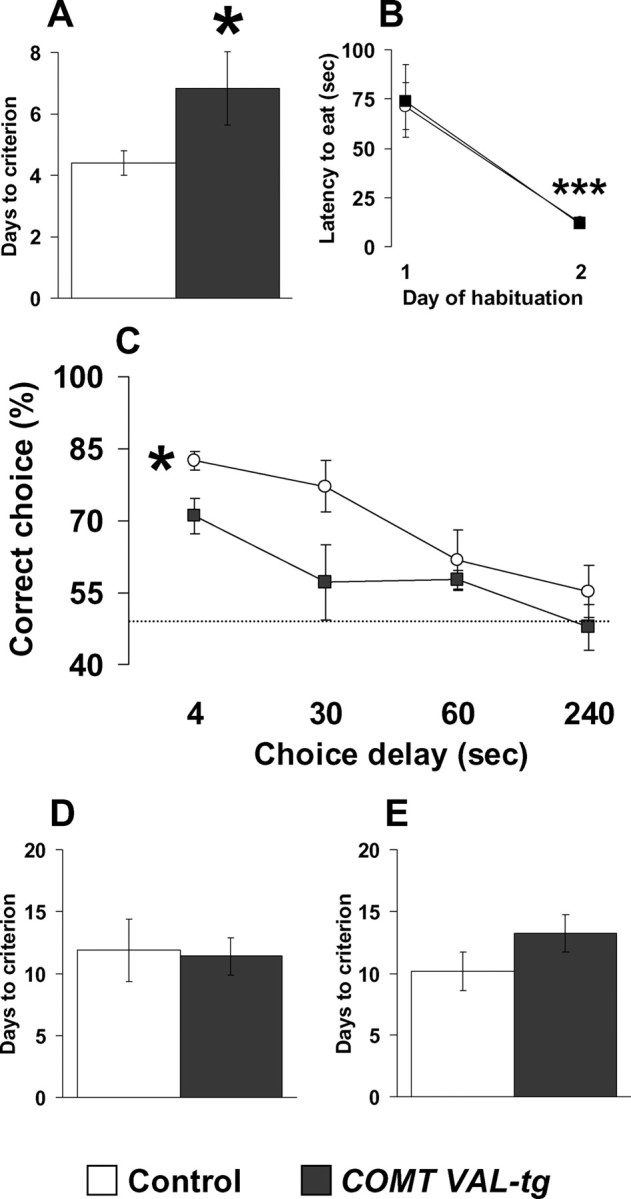
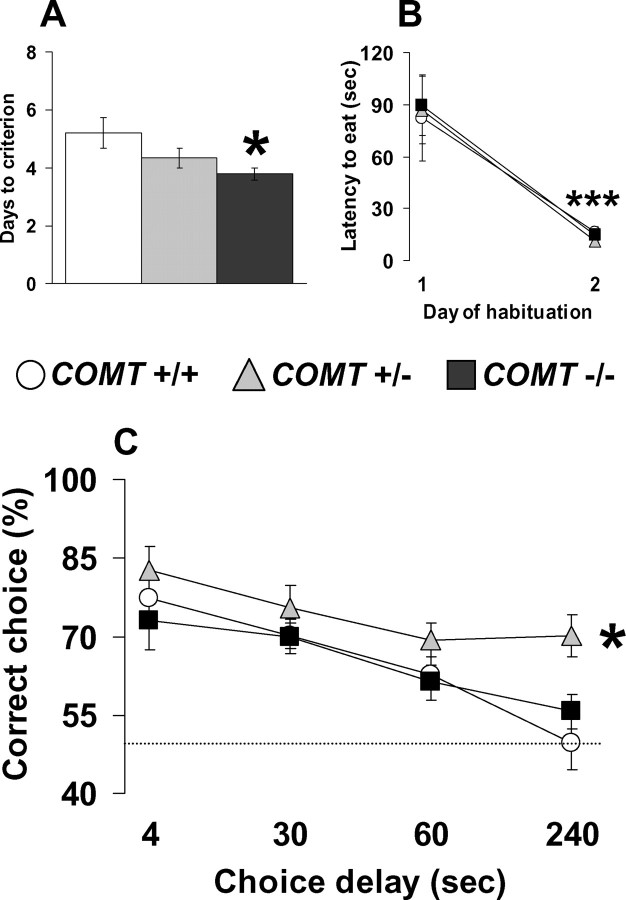
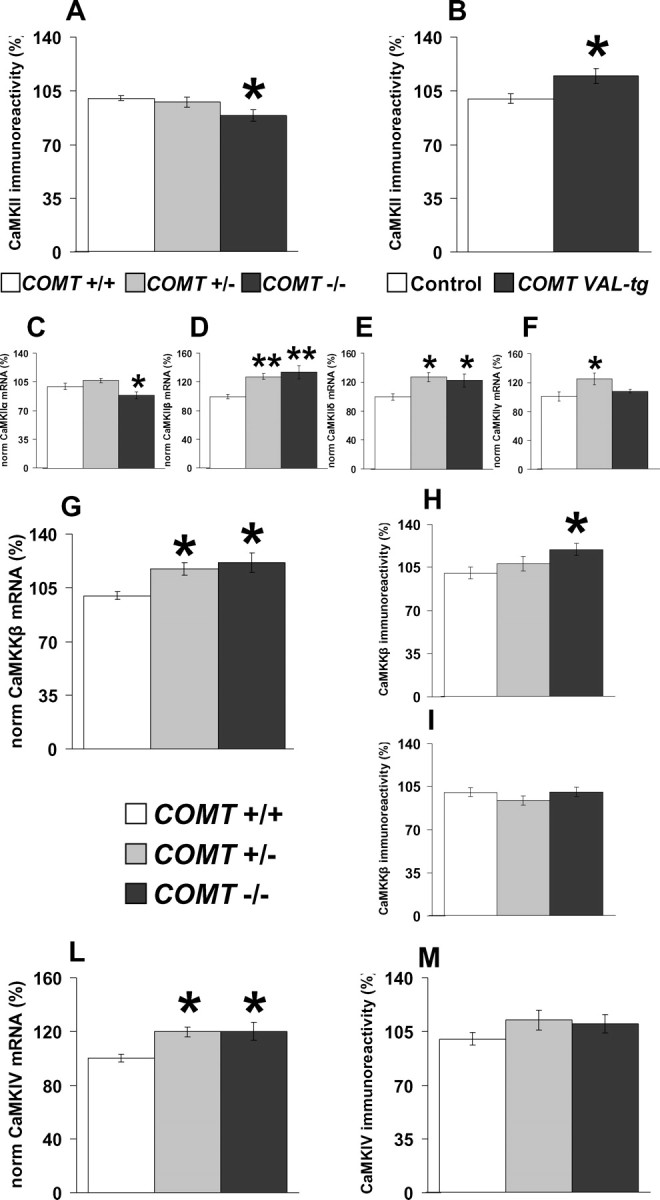
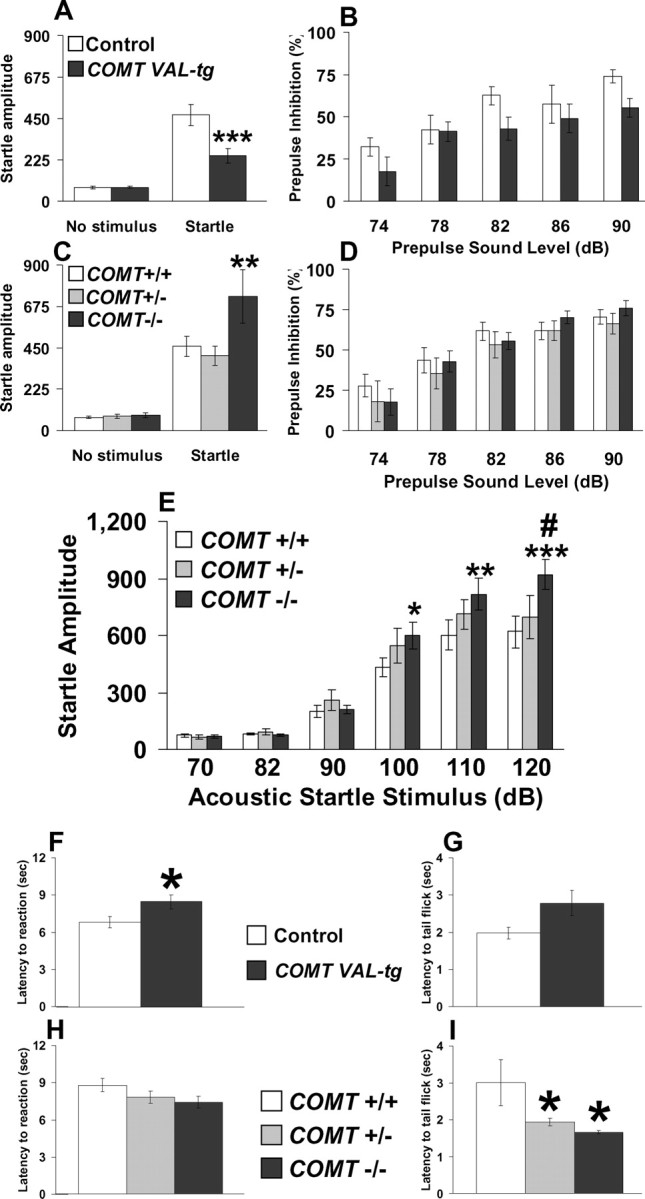
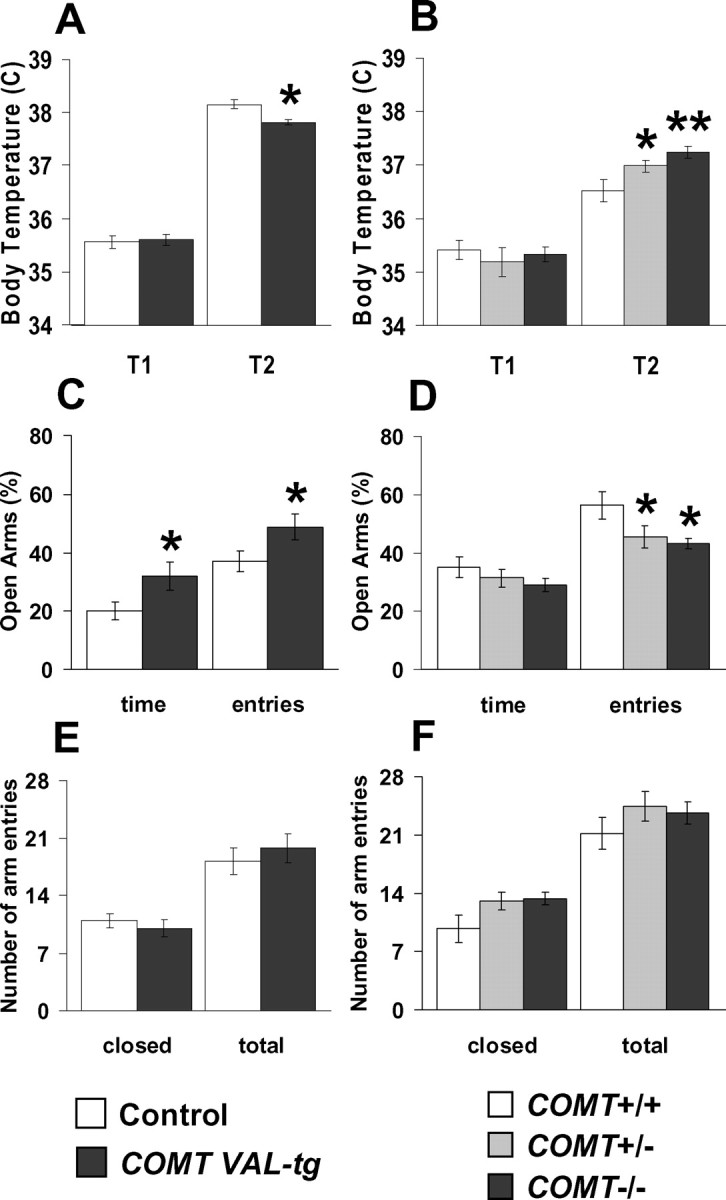
The COMT (catechol-O-methyltransferase) gene has been linked to a spectrum of human phenotypes, including cognition, anxiety, pain sensitivity and psychosis. Doubts about its clinical impact exist, however, because of the complexity of human COMT polymorphism and clinical variability. We generated transgenic mice overexpressing a human COMT-Val polymorphism (Val-tg), and compared them with mice containing a null COMT mutation. Increased COMT enzyme activity in Val-tg mice resulted in disrupted attentional set-shifting abilities, and impaired working and recognition memory, but blunted stress responses and pain sensitivity. Conversely, COMT disruption improved working memory, but increased stress responses and pain sensitivity. Amphetamine ameliorated recognition memory deficits in COMT-Val-tg mice but disrupted it in wild types, illustrating COMT modulation of the inverted-U relationship between cognition and dopamine. COMT-Val-tg mice showed increased prefrontal cortex (PFC) calcium/calmodulin-dependent protein kinase II (CaMKII) levels, whereas COMT deficiency decreased PFC CaMKII but increased PFC CaMKKbeta and CaMKIV levels, suggesting the involvement of PFC CaMK pathways in COMT-regulated cognitive function and adaptive stress responses. Our data indicate a critical role for the COMT gene in an apparent evolutionary trade-off between cognitive and affective functions.


Conflict of interest statement

The authors declare that they have no financial conflict of interest.

Figures

Figure 1.
Figure 1.
Gene divergence Kozak mutation and generation of transgenic mice overexpressing the human COMT-Val gene. A, MB-COMT and S-COMT proteins were generated by in vitro protein synthesis using 35S-methionine as labeling substrate and mouse and human COMT cDNAs as templates. B, Ratio of the MB-COMT versus S-COMT proteins. C, MB-COMT and S-COMT proteins were generated as above and using human wild-type and Kozak mutant COMT cDNAs as templates. D, Mutation at the Kozak sequence of human COMT cDNA decreased the ratio of the MB-COMT versus S-COMT proteins. E, Schematic diagram of a tetracycline-regulated gene expression system. Neuron-specific expression of tTA containing the tetracycline binding domain from the tetracycline receptor (TetR) and transactivation domain from the viral transcription factor VP16 is driven by the NSE promoter. The tTA can bind to the tetracycline-responsive promoter, which contains TetO and minimal CMV promoter carrying only TATA box to activate the expression of the human COMT-Val transgene. Expression of the transgene can be switched off by tetracycline. F, Expression of human COMT-Val protein in the frontal cortex, hippocampus, and striatum of mice carrying the NSE-tTA alone [hCOMT(−/−)/tTA(+/−)], the human COMT-Val transgene alone [hCOMT(+/−)/tTA(−/−)], or both transgenes [hCOMT(+/−)/(tTA+/−) or (tTA+/+)]. G, Overexpression of the COMT gene was restricted to neurons and the major cell type expressing the human COMT-Val-tg was pyramidal neurons. Neurons expressing the COMT-Val-tg were detected by immunostaining with specific anti-human COMT antibody. H, COMT enzyme activity in the frontal cortex of the COMT-Val-tg mice and their controls. n = 17–21 per group. *p < 0.05 versus control mice. I–M, Immunoreactivity of (I) TH, (L) DβH and (M) GAD67 proteins in the frontal cortex of the COMT-Val-tg mice and their controls. n = 4–9 per group. Results are expressed as percentage over the average of the control group. Values represent mean ± SEM. *p < 0.05 versus control mice.
Figure 2.
Figure 2.
Selective impairment in shifting of attentional-set in COMT-Val-tg mice. A, B, Trials to criteria (A) and minutes to complete the different stages of the attentional set-shifting task (B) grouped by COMT-Val-tg and control littermates. Values represent mean ± SEM. n = 7–8 per group. ***p < 0.0005 versus the performance of control mice in all of the stages encountered; ### p < 0.0005 versus their own performance in all of the other stages. In our modified paradigm, the mice were able to acquire this demanding task in 3–7 d, a considerably shorter time than that reported in a previous study (Garner et al., 2006).
Figure 3.
Figure 3.
Impaired object recognition memory in COMT-Val-tg mice is reversed by amphetamine treatment. A, Time spent exploring two identical objects displayed by COMT-Val-tg and their control littermates during the 10 min acquisition session of the object recognition test. n = 8–11 per group. B, Percentage of the time spent exploring the new object over the total time spent in exploring both objects by COMT-Val-tg and control mice during the 5 min retention trial of the novel object recognition test, performed 1 h after the acquisition session. n = 7–11 per group. *p < 0.05 versus control mice. C, Percentage of the time spent exploring the new object over the total time spent in the exploration of the two objects during the 5 min retention trial with a 1 h delay, displayed by COMT-Val-tg and control mice treated with vehicle or amphetamine (1.5 mg/kg, i.p.) immediately after the acquisition session. The dotted lines correspond to chance levels (50%) of new object exploration. n = 7–12 per group. *p < 0.05 versus vehicle-treated control mice; # p < 0.05 versus vehicle-treated COMT-Val-tg mice. D, Ambulatory distance in 5 min bins displayed by control and COMT-Val-tg mice during the 10 min before and 1 h and 15 min after the vehicle or amphetamine (1.5 mg/kg, i.p.) injection. Note that these are the same open-field apparatus and timing used in the different phases of the novel object recognition memory test. n = 4–6 per group. E–G, Time spent exploring (E) and avoiding (F), and number of stretching attempts toward the two identical objects (G), displayed by COMT+/+, COMT+/−, and COMT−/− littermates during the 10 min acquisition session of the object recognition test. n = 5–7 per group. *p < 0.05 versus COMT+/+ mice. Values represent mean ± SEM.
Figure 4.
Figure 4.
Specific working memory impairments in COMT-Val-tg mice. A, B, Days needed to reach the criteria (A) and latency to retrieve the hidden food pellet displayed by control and COMT-Val-tg mice during the discrete paired-trial T-maze task (B). n = 6–10 per group. *p < 0.05 versus control mice; ***p < 0.0001 versus day 1 of the habituation. C, Percentage of correct choices displayed by control and COMT-Val-tg mice during the discrete paired-trial variable-delay T-maze task with different intratrial delays randomly presented (4, 30, 60, and 240 s) and an intertrial delay of 20 s. The dotted line corresponds to chance levels (50%) of correct choices. n = 6–10 per group. *p < 0.01 versus control mice. D, E, Days needed to reach the criteria displayed by control and COMT-Val-tg mice during the continuous spatial alternation T-maze task (D; n = 8–15 per group) and during the reversal phase (E; n = 7–13 per group). Values represent mean ± SEM.
Figure 5.
Figure 5.
Better working memory performance in COMT knock-out mice. A, B, Days needed to reach the criteria (A) and latency to retrieve the hidden food pellet (B) displayed by COMT+/+, COMT+/−, and COMT−/− mice during the discrete paired-trial T-maze task. n = 10–14 per group. *p < 0.05 versus COMT+/+ mice; ***p < 0.0001 versus day 1 of the habituation. C, Percentage of correct choices displayed by COMT+/+, COMT+/−, and COMT−/− during the discrete paired-trial variable-delay T-maze task with different intratrial delays randomly presented (4, 30, 60, and 240 s) and an intertrial delay of 20 s. The dotted line corresponds to chance levels (50%) of correct choices. n = 10–14 per group. *p < 0.01 versus COMT+/+ and COMT−/− mice. Values represent mean ± SEM.
Figure 6.
Figure 6.
COMT specifically modulate PFC CaMK superfamily components. A, B, CaMKII protein immunoreactivity levels in the PFC of COMT+/+, COMT+/−, COMT−/− (A) and control and COMT-Val-tg mice (B) by immunoblot analysis. n = 10–16 per group. *p < 0.05 versus proper wild-type control group. C–F, Normalized expression levels of CaMKII mRNA α- (C), β- (D), δ- (E), and γ- (F) subunits in the PFC of COMT+/+, COMT+/− and COMT−/− mice. n = 9–10 per group. *p < 0.05; **p < 0.005 versus COMT+/+ mice. G–I, Normalized expression levels of CaMKKβ mRNA (G) and protein, heavier (H), and lighter (I) band by immunoblot analysis in the PFC of COMT+/+, COMT+/−, and COMT−/− mice. n = 9–10 per group. *p < 0.05 versus COMT+/+ mice. The CaMKKβ heavier band has been reported to be brain-specific (Anderson et al., 1998). L, M, Normalized expression levels of CaMKIV mRNA (L) and protein (M) in the PFC of COMT+/+, COMT+/−, and COMT−/− mice. n = 9–28 per group. *p < 0.05 versus COMT+/+ mice. Results are expressed as percentage of the COMT+/+ group for each experiment. Values represent mean ± SEM.
Figure 7.
Figure 7.
Acoustic startle and pain sensitivity are blunted in COMT-Val-tg mice and exaggerated in COMT−/− mice. A, C, Startle amplitude displayed by control and COMT-Val-tg mice (A) and COMT+/+, COMT+/−, and COMT−/− mice (C) after the presentation of no stimulus or a 120 dB stimulus (Startle). B, D, Percentage prepulse inhibition of the acoustic startle response displayed by the same COMT transgenic mice (B) and COMT knock-out mice (D) after the presentation of 74, 78, 82, 86, and 90 dB prepulse sound stimuli. n = 11–18 per group. ***p < 0.0005 versus control mice startle response; **p < 0.005 versus COMT+/+ and COMT+/− mice startle response. E, Startle reaction amplitude displayed by COMT+/+, COMT+/−, and COMT−/− mice after the presentation of 40 ms, 70, 82, 90, 100, 110, and 120 dB acoustic startle stimuli. n = 11–14 per group. *p < 0.05; **p < 0.001; ***p < 0.0001 versus COMT+/+ mice; # p < 0.01 versus COMT+/− mice. F, G, Comparison of COMT-Val-tg and control littermates on reaction latency in the hot plate test (F; n = 17–21 per group) and in the tail flick test (G; n = 24–31 per group). *p < 0.05 versus control mice. H, I, Comparison of COMT+/+, COMT+/−, and COMT−/− littermates on reaction latency in the hot plate test (H; n = 19–24 per group) and in the tail flick test (I; n = 13–15 per group). *p < 0.05 versus COMT+/+ mice. Values represent mean ± SEM.
Figure 8.
Figure 8.
Anxiety-like traits are decreased in COMT-Val-tg mice and increased in COMT−/− mice. A, Body temperatures displayed by control and COMT-Val-tg mice before (T1) and 25 min after (T2) the manipulation of the mice, consisting of handling and insertion of the rectal probe, plus a supplemental stress, consisting of placing the animals in a clean new cage. n = 13–16 per group. *p < 0.05 versus T2 of control mice. B, Body temperatures displayed by COMT+/+, COMT+/−, and COMT−/− mice before (T1) and 10 min after (T2) handling and insertion of the rectal probe. n = 9–11 per group. *p < 0.05; **p < 0.005 versus T2 of COMT+/+ mice. C, D, In the elevated plus maze, the percentage of time spent in the open arms and number of visits to the open arms were (C) significantly higher for COMT-Val-tg mice and (D) less for COMT−/− and COMT+/− mice. n = 9–15 per group. *p < 0.05 versus proper wild-type control group. E, F, Locomotor activity in the elevated plus maze was not different between control and mutant mice as measured by closed arm entries and total arm entries. Values represent mean ± SEM.

References

    1. Adriaan Bouwknecht J, Olivier B, Paylor RE. The stress-induced hyperthermia paradigm as a physiological animal model for anxiety: a review of pharmacological and genetic studies in the mouse. Neurosci Biobehav Rev. 2007;31:41–59. - PubMed
    1. Akil M, Kolachana BS, Rothmond DA, Hyde TM, Weinberger DR, Kleinman JE. Catechol-O-methyltransferase genotype and dopamine regulation in the human brain. J Neurosci. 2003;23:2008–2013. - PMC - PubMed
    1. Anderson KA, Means RL, Huang QH, Kemp BE, Goldstein EG, Selbert MA, Edelman AM, Fremeau RT, Means AR. Components of a calmodulin-dependent protein kinase cascade. Molecular cloning, functional characterization and cellular localization of Ca2+/calmodulin-dependent protein kinase kinase beta. J Biol Chem. 1998;273:31880–31889. - PubMed
    1. Arnsten AF. Stress impairs prefrontal cortical function in rats and monkeys: role of dopamine D1 and norepinephrine alpha-1 receptor mechanisms. Prog Brain Res. 2000;126:183–192. - PubMed
    1. Aultman JM, Moghaddam B. Distinct contributions of glutamate and dopamine receptors to temporal aspects of rodent working memory using a clinically relevant task. Psychopharmacology (Berl) 2001;153:353–364. - PubMed

Publication types

MeSH terms