. 2008 Nov;19(11):4717-29.
doi: 10.1091/mbc.e07-08-0768. Epub 2008 Aug 27.

Antagonistic regulation of cell-matrix adhesion by FosB and DeltaFosB/Delta2DeltaFosB encoded by alternatively spliced forms of fosB transcripts

Affiliations

Antagonistic regulation of cell-matrix adhesion by FosB and DeltaFosB/Delta2DeltaFosB encoded by alternatively spliced forms of fosB transcripts

Yoshinori N Ohnishi et al. Mol Biol Cell. 2008 Nov.

Abstract

Among fos family genes encoding components of activator protein-1 complex, only the fosB gene produces two forms of mature transcripts, namely fosB and DeltafosB mRNAs, by alternative splicing of an exonic intron. The former encodes full-length FosB. The latter encodes DeltaFosB and Delta2DeltaFosB by alternative translation initiation, and both of these lack the C-terminal transactivation domain of FosB. We established two mutant mouse embryonic stem (ES) cell lines carrying homozygous fosB-null alleles and fosB(d) alleles, the latter exclusively encoding DeltaFosB/Delta2DeltaFosB. Comparison of their gene expression profiles with that of the wild type revealed that more than 200 genes were up-regulated, whereas 19 genes were down-regulated in a DeltaFosB/Delta2DeltaFosB-dependent manner. We furthermore found that mRNAs for basement membrane proteins were significantly up-regulated in fosB(d/d) but not fosB-null mutant cells, whereas genes involved in the TGF-beta1 signaling pathway were up-regulated in both mutants. Cell-matrix adhesion was remarkably augmented in fosB(d/d) ES cells and to some extent in fosB-null cells. By analyzing ES cell lines carrying homozygous fosB(FN) alleles, which exclusively encode FosB, we confirmed that FosB negatively regulates cell-matrix adhesion and the TGF-beta1 signaling pathway. We thus concluded that FosB and DeltaFosB/Delta2DeltaFosB use this pathway to antagonistically regulate cell matrix adhesion.


Figures

Figure 1.
Figure 1.
Strategy for generation of mutant fosB alleles by gene targeting. (A) Genomic organization of the mouse fosB gene, its transcripts (fosB and ΔfosB mRNAs) and translation products (FosB, ΔFosB, and Δ2ΔFosB proteins) are shown. FH, N-terminal Fos homology domain; BZIP, basic region and leucine zipper; C-TA, C-terminal transactivation domain; TBP-BD, TBP-binding domain. Each pair of dotted lines indicates the splicing of each intron and a red box indicates an exonic intron in exon 4, which is alternatively spliced out (red dotted lines). (B) Strategy for generation of a fosBd allele that encodes only ΔFosB/Δ2ΔFosB. The targeting vector, pTVfosBdN, carries all exons and introns of the fosB gene flanked by two HSV-TK genes (TK1, TK2) at BamHI sites, labeled B. Two tandem stop codons (red letters) were introduced by three base substitutions (bold letters) at the alternative splicing site in exon 4. Gray box, neo cassette; white arrow, direction of the neo gene; red triangle, loxP site. Sequences of a transcript (fosBd mRNA) from the fosBd or fosBdN allele or from the wild-type (fosB+) allele, and the corresponding amino acid residues are shown. The arc with an arrowhead indicates the alternative splicing of the exonic intron (red box). (C) Structures of mutant fosB alleles. The fosBd allele was generated by transient expression of Cre recombinase in cells carrying homozygous fosBdN alleles. In the fosBGN allele, parts of exon 2 and exon 3 with intron 2 were replaced with d2EGFP and the neo cassette with two loxP sites. Blue arrowheads, primers used for RT-PCR, genomic PCR, and sequencing of the products; blue bars, probes for Southern blotting, green box, d2EGFP cDNA; Sp, SpeI; B, BamHI; Sa, SacI; X, XhoI; N, NotI.
Figure 2.
Figure 2.
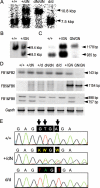
Establishment of ES cell lines carrying mutant fosB alleles by gene targeting. (A) Southern blot analysis of fosBdN and fosBd alleles. A single 7.5-kbp band was detected in the wild type (fosB+/+), whereas a 10.8-kbp band was detected as a fragment derived from the fosBdN allele in the fosB+/dN heterozygote. In the fosBdN/dN homozygote, only the 10.8-kbp band was detected. In the fosBd/d homozygote, a single 7.5-kbp band was detected in which the 3.3-kbp neo cassette was excised by Cre recombinase. (B) Southern blot analysis of the fosBGN allele. In the wild type, a 9.4-kbp band was detected, whereas an additional 8.0-kbp band was detected as a fragment derived from the fosBGN allele in the fosB+/GN heterozygote. (C) Genomic PCR analysis of the fosBGN allele. From the wild-type allele, a 935-base pair band was amplified by FB1 and FB4, whereas a 1178-base pair band was amplified from the fosBGN allele with FB1 and FB3. (D) RT-PCR analysis of the mutant fosB transcripts. Total RNA was prepared from ES cells stimulated for 45 min with 20% serum. With the primers FB1 and FB2 (top panel), a 143-base pair fragment was expected to be amplified from fosB transcripts from wild-type, fosBdN, and fosBd alleles but not from the fosBGN allele. With the primers FB5 and FB6 (the second panel), a 1154-base pair fragment was expected to be amplified from FosB(N)-d2EGFP fusion mRNA transcribed from the fosBGN allele. With the primers FB1 and FB8 (third panel), an 898-base pair fragment from FosB mRNA and a 757-base pair fragment from ΔFosB mRNA were expected to be amplified. Gapdh mRNA was amplified as an internal control (bottom panel). (E) Sequencing analysis of genomic PCR products. Genomic DNA prepared from wild-type and fosB+/dN and fosBd/d ES cells was subjected to PCR amplification with primers FB7 and FB8, and base substitutions (arrows) introduced into the mutant alleles were confirmed by direct sequencing. In the sequence for +/dN, K represents two peaks for guanine and thymine, whereas W represents two peaks for adenine and thymine.
Figure 3.
Figure 3.
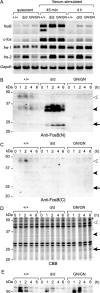
Characterization of ES cell lines carrying mutant fosB alleles. (A) RT-PCR analysis of fos family mRNAs after serum stimulation. fosB cDNA was amplified with primers FB7 and FB8. (B) Western blotting with anti-FosB(N). Nuclear extracts (100 μg per lane) prepared from ES cells at given times after serum stimulation of quiescent cells (0 h) were subjected to Western blotting with anti-FosB(N), which reacts with both FosB and ΔFosB. (C) Western blotting with anti-FosB(C). A sister blot prepared as shown in B was probed with anti-FosB(C), which reacts with only with FosB. (D) A sister gel stained with Coomassie brilliant blue (CBB). In B–D, open arrowheads indicate p43, the closed arrowhead indicates p32/36, and the arrow indicates p24, respectively. (E) Western blotting with anti-c-Fos. A sister blot prepared as shown in A was probed with anti-c-Fos.
Figure 4.
Figure 4.
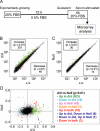
Comparison of gene expression profiles among fosB mutant and wild-type ES cells. (A) Experimental schedules. (B) Comparison of gene expression profiles between fosBd/d and wild-type ES cells. The average intensity of 5290 processed probes, excluding those with outlier signals and signals lower than the threshold, was plotted as a scatter diagram. Significantly up-regulated genes are shown in green, whereas down-regulated genes are shown in red (p < 0.01). (C) Comparison of gene expression profiles of fosB-null and wild-type ES cells. Data are shown as in B. (D) Comparison of gene expression profiles of fosBd/d and fosB-null ES cells on a logarithmic scale. Data were transformed from B and C for comparison with the wild type.
Figure 5.
Figure 5.
Altered gene expression profiles among fosB mutant and wild-type ES cells. (A) Expression of genes for basement membrane proteins. RNA prepared from quiescent ES cells or ES cells 4 h after serum stimulation were subjected to RT-PCR analysis. The relative amount of each RT-PCR product to that of the quiescent wild type was normalized with that of Gapdh mRNA and is shown in parentheses. (B) Expression of ΔFosB protein in fosBd/d ES cells. Nuclear extracts (200 μg per lane) prepared from exponentially growing or quiescent ES cells were subjected to Western blotting with anti-FosB(N; top panel). Membranes stained with CBB are shown (bottom panel). The arrowhead indicates p32/36, and the arrow indicates p24. (C). RT-PCR analysis of genes for basement membrane proteins in exponentially growing ES cells. The amount of each RT-PCR product relative to that of the wild type was normalized with that of Gapdh mRNA and is shown in parenthesis. (D) RT-PCR analysis of Tgfb1 and Tgfb1i1 expression. The amount of each RT-PCR product relative to that of the exponentially growing wild type (left panel, exponential) or to that of the quiescent wild type (right panel, quiescent and serum-stimulated) was normalized with that of Gapdh mRNA, and is shown in parentheses.
Figure 6.
Figure 6.
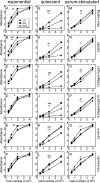
Increased cell-matrix adhesion in fosBd/d and fosB-null ES cells. Cell adhesion to five different matrices was examined using cells prepared under three different culture conditions: in an exponentially growing culture (A–F); a quiescent culture (G–L); and 4 h after serum stimulation (M–R), as described in Materials and Methods. The extent of cell adhesion is shown as the absorbance at 595 nm (mean ± SEM, n = 3). # p < 0.05; ## p < 0.01; ### p < 0.001; statistical difference between wild-type and fosBd/d ES cells. * p < 0.05; ** p < 0.01, *** p < 0.001; statistical difference between wild-type and fosB-null ES cells.
Figure 7.
Figure 7.
Decreased cell-matrix adhesion in fosBFN/FN ES cells. (A) Strategy for generation of a fosBFN allele which encodes only FosB. The targeting vector, pTVfosBFN, is flanked by two HSV-TK genes (TK1, TK2) at BamHI sites, labeled B. Five base substitutions (red letters) are introduced at the alternative splicing donor and acceptor sites in exon 4, and an inverted neo cassette (gray box) flanked by two loxP sites (red triangles) was placed in intron 3. Sequences of a transcript (fosBF mRNA) from the fosBFN allele or from the wild-type (fosB+) allele, and corresponding amino acid residues are shown. The arc with the arrowhead indicates the alternative splicing of the exonic intron (red box). (B) RT-PCR analysis of fosB mRNAs in exponentially growing cells. fosB cDNA was amplified with primers FB7 and FB8. (C) Quantitative RT-PCR analysis of the Tgfb1i1 gene in exponentially growing ES cells. The relative level of Tgfb1i1 mRNA in each cell line to that of the wild type is shown as a bar graph (mean ± SEM, n = 3). (D) Cell-matrix adhesion was examined using exponentially growing cells at 2 × 10⁵ cells per well. The extent of cell adhesion is shown as the absorbance (%) relative to absorbance at 595 nm for wild-type cells (mean ± SEM, n = 4). * p <0.05; *** p <0.001; statistical difference from wild-type cells using ANOVA.
Figure 8.
Figure 8.
Signaling pathway for proceeding from FosB or ΔFosB/Δ2ΔFosB toward thrombospondin 1/TGF-β1, which regulates cell-matrix adhesion. Thrombospondin 1/TGF-β1 signaling, which may be negatively regulated by Jun/Fos complexes (active AP-1), enhances cell-matrix adhesion and up-regulates genes for basement membrane proteins through fosB gene expression. ΔFosB and Δ2ΔFosB antagonize not only FosB but also other Fos family members (Fos) constituting the major AP-1 complexes with the three Jun proteins (Jun), and they may up-regulate the TGF-β1 signaling pathway independent of intrinsic AP-1 activity. See details in the text and Supplemental Figure S2. Red represents up-regulated genes and blue indicates down-regulated genes.

Similar articles

Cited by

References

    1. Acquaviva C., Ferrara P., Bossis G., Brockly F., Salvat C., Jariel-Encontre I., Piechaczyk M. Degradation of cellular and viral Fos proteins. Biochimie. 2001;83:357–362. - PubMed
    1. Bertrand-Philippe M., Ruddell R. G., Arthur M. J., Thomas J., Mungalsingh N., Mann D. A. Regulation of tissue inhibitor of metalloproteinase 1 gene transcription by RUNX1 and RUNX2. J. Biol. Chem. 2004;279:24530–24539. - PubMed
    1. Boengler K., Pipp F., Fernandez B., Ziegelhoeffer T., Schaper W., Deindl E. Arteriogenesis is associated with an induction of the cardiac ankyrin repeat protein (carp) Cardiovasc. Res. 2003;59:573–581. - PubMed
    1. Botella L. M., et al. Transcriptional activation of endoglin and transforming growth factor-β signaling components by cooperative interaction between Sp1 and KLF6, their potential role in the response to vascular injury. Blood. 2002;100:4001–4010. - PubMed
    1. Chen J., Kelz M. B., Hope B. T., Nakabeppu Y., Nestler E. J. Chronic Fos-related antigens: stable variants of ΔFosB induced in brain by chronic treatments. J. Neurosci. 1997;17:4933–4941. - PMC - PubMed

Publication types

MeSH terms

LinkOut - more resources