. 2008 Sep 2;105(35):12748-53.
doi: 10.1073/pnas.0803354105. Epub 2008 Aug 27.

Amorphous calcium phosphate is a major component of the forming fin bones of zebrafish: Indications for an amorphous precursor phase

Affiliations

Amorphous calcium phosphate is a major component of the forming fin bones of zebrafish: Indications for an amorphous precursor phase

Julia Mahamid et al. Proc Natl Acad Sci U S A. .

Abstract

A fundamental question in biomineralization is the nature of the first-formed mineral phase. In vertebrate bone formation, this issue has been the subject of a long-standing controversy. We address this key issue using the continuously growing fin bony rays of the Tuebingen long-fin zebrafish as a model for bone mineralization. Employing high-resolution scanning and transmission electron microscopy imaging, electron diffraction, and elemental analysis, we demonstrate the presence of an abundant amorphous calcium phosphate phase in the newly formed fin bones. The extracted amorphous mineral particles crystallize with time, and mineral crystallinity increases during bone maturation. Based on these findings, we propose that this amorphous calcium phosphate phase may be a precursor phase that later transforms into the mature crystalline mineral.


Conflict of interest statement

The authors declare no conflict of interest.

Figures

Fig. 1.
Fig. 1.
Polarized-light micrographs, SEM, and micro-CT image of the continuously elongating TL caudal fin. (A) Freshly dissected TL caudal fin observed under a polarized-light microscope in water, showing the overall structure of the skeletal elements of the bony rays. An increase in birefringence is observed, starting from the distal end where elongation and new bone formation occur. (Scale bar: 0.5 mm.) (B) Scanning electron micrograph of native fin ray segments after the surrounding tissue was removed, dehydrated in an ethanol series, and critical-point dried, showing the half-cylindrical structure of hemisegments that constitute half of the skeletal bony ray. (Scale bar: 200 μm.) (C) Intensity plots of birefringence (orange) and mineral density (gray) signals generated from the polarized-light micrograph and micro-CT image, respectively, of a ray shown on the same scale. The dashed lines mark the distinct segments of the ray. Spikes of increased birefringence at the boundaries between segments are due to massive collagen bundles comprising the flexible joints. The blue lines delimit the regions with different signal intensity observed in the birefringence plot.
Fig. 2.
Fig. 2.
High-resolution scanning electron micrographs of mineral particle morphologies in different parts along the growing fin bony rays, representing different growth stages. (A) Native bony segment showing local layered organization of mineral platelets within the organic matrix. (Scale bar: 200 nm.) (B) Proximal, mature bone segment after removal of organic matrix, showing well defined platelet morphology of the carbonated apatite crystallite. (C) Coexistent small platelets (black arrows) and spherically shaped mineral particles (white arrowheads) comprise a fragment at a transition zone from mature to growing bone. (D) Distal, forming bone segments, almost exclusively composed of dense spherical mineral particles. (E) A bone fragment showing that the crystal platelets also appear to be composed of spherical subparticles. (Scale bars in B–E: 100 nm.) Samples B–E were prepared by washing in acetone, crushing after rapid freezing in liquid nitrogen, removal of organic matrix by immersion in 6% NaOCl, extensive washing, resuspension in ethanol, mounting after evaporation of the ethanol suspension, and coated with 2-nm Cr.
Fig. 3.
Fig. 3.
TEM and SAED correlated with SEM and ESB imaging of mineral freshly extracted from the distal end of the fin. (A and B) TEM micrograph of mineral particle aggregates and the corresponding SAED patterns: encircled particle produces amorphous scatter of diffuse rings (SAED, B.a). Area marked with a rectangle produces poorly crystalline diffraction (SAED, B.b), and particle in Inset produces a clear crystalline diffraction pattern (SAED, B.c), showing well defined reflections of the (002) and second order (004) apatite planes. SAED B.d corresponds to the encircled area examined after storage for 1 week at room temperature: As the particles begin to crystallize, diffraction spots with spacing of the (002) plane appear (arrowheads), implying conversion into a crystalline apatite phase. (C) High-resolution cryo-SEM micrograph of the same particle, uncoated, taken after examination in the TEM. (D) Corresponding ESB image, showing no distinguishable difference between the signal intensity of the amorphous (encircled area) and crystalline (rectangular area) mineral parts. (Scale bars 100 nm.) Samples were prepared by washing in acetone, crushing after rapid freezing in liquid nitrogen, immersion in 6% NaOCl, extensive washing, resuspension in ethanol, sonication, and mounting by evaporating the ethanol suspension on a marked TEM grid.
Fig. 4.
Fig. 4.
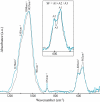
Representative FTIR spectra of freshly extracted mineral particles from the proximal, mature bone (black) and distal, forming bone (blue) segments of the same fin after removal of the bone organic matrix and sonication into ethanol. The spectra are normalized to the intensity of the phosphate ν1, ν3 peak at 1,035 cm−1 after baseline correction. (Inset) Spectra normalized to the intensity of the 562-cm−1 peak. Black: IR spectrum of particles extracted from proximal bone segments; SF = 3.17. Blue: IR spectrum of particles extracted from distal bone segments; SF = 2.58. The difference in SF corresponds to the higher degree of crystallinity of the proximal segments.

Similar articles

Cited by

References

    1. Towe KM, Lowenstam HA. Ultrastructure and development of iron mineralization in the radular teeth of Cryptochiton stelleri (Mollusca) J Ultrastructure Res. 1967;17:1–13. - PubMed
    1. Lowenstam HA, Weiner S. Transformation of amorphous calcium phosphate to crystalline dahillite in the radular teeth of chitons. Science. 1985;227:51–53. - PubMed
    1. Beniash E, Aizenberg J, Addadi L, Weiner S. Amorphous calcium carbonate transforms into calcite during sea-urchin larval spicule growth. Proc R Soc London Ser B. 1997;64:461–465.
    1. Hasse B, et al. Calcium carbonate modifications in the mineralized shell of the freshwater snail Biomphalaria glabrata. Chem Eur J. 2000;6:3679–3685. - PubMed
    1. Weiss IM, Tuross N, Addadi L, Weiner S. Mollusk larval shell formation: amorphous calcium carbonate is a precursor for aragonite. J Exp Zool. 2002;293:478–491. - PubMed

Publication types

MeSH terms

Substances