Factorial microarray analysis of zebrafish retinal development
- PMID: 18753621
- PMCID: PMC2529063
- DOI: 10.1073/pnas.0806038105
Factorial microarray analysis of zebrafish retinal development
Abstract
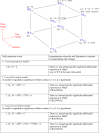
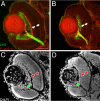
In a zebrafish recessive mutant young (yng), retinal cells are specified to distinct cell classes, but they fail to morphologically differentiate. A null mutation in a brahma-related gene 1 (brg1) is responsible for this phenotype. To identify retina-specific Brg1-regulated genes that control cellular differentiation, we conducted a factorial microarray analysis. Gene expression profiles were compared from wild-type and yng retinas and stage-matched whole embryos at 36 and 52 hours postfertilization (hpf). From our analysis, three categories of genes were identified: (i) Brg1-regulated retinal differentiation genes (731 probesets), (ii) retina-specific genes independent of Brg1 regulation (3,038 probesets), and (iii) Brg1-regulated genes outside the retina (107 probesets). Biological significance was confirmed by further analysis of components of the Cdk5 signaling pathway and Irx transcription factor family, representing genes identified in category 1. This study highlights the utility of factorial microarray analysis to efficiently identify relevant regulatory pathways influenced by both specific gene products and normal developmental events.
Conflict of interest statement
The authors declare no conflict of interest.
Figures


Similar articles
-
Cellular expression of Smarca4 (Brg1)-regulated genes in zebrafish retinas.BMC Dev Biol. 2011 Jul 14;11:45. doi: 10.1186/1471-213X-11-45. BMC Dev Biol. 2011. PMID: 21756345 Free PMC article.
-
Critical role of Brg1 member of the SWI/SNF chromatin remodeling complex during neurogenesis and neural crest induction in zebrafish.Dev Dyn. 2006 Oct;235(10):2722-35. doi: 10.1002/dvdy.20911. Dev Dyn. 2006. PMID: 16894598
-
Expression profiling of the RPE in zebrafish smarca4 mutant revealed altered signals that potentially affect RPE and retinal differentiation.Mol Vis. 2014 Jan 6;20:56-72. eCollection 2014. Mol Vis. 2014. PMID: 24426776 Free PMC article.
-
Irx7, a Smarca4-regulated gene for retinal differentiation, regulates other genes controlled by Smarca4 in zebrafish retinas.Gene Expr Patterns. 2013 Jun-Jul;13(5-6):177-82. doi: 10.1016/j.gep.2013.03.003. Epub 2013 Apr 1. Gene Expr Patterns. 2013. PMID: 23557786
-
Retinal pattern and the genetic basis of its formation in zebrafish.Semin Cell Dev Biol. 2004 Feb;15(1):105-14. doi: 10.1016/j.semcdb.2003.09.008. Semin Cell Dev Biol. 2004. PMID: 15036213 Review.
Cited by
-
Cross-generational plasticity in Atlantic silversides (Menidia menidia) under the combined effects of hypoxia and acidification.J Exp Biol. 2025 Aug 1;228(15):jeb249726. doi: 10.1242/jeb.249726. Epub 2025 Jul 25. J Exp Biol. 2025. PMID: 40626633 Free PMC article.
-
Slc4a7 Regulates Retina Development in Zebrafish.Int J Mol Sci. 2024 Sep 5;25(17):9613. doi: 10.3390/ijms25179613. Int J Mol Sci. 2024. PMID: 39273559 Free PMC article.
-
Myogenic microRNA expression requires ATP-dependent chromatin remodeling enzyme function.Mol Cell Biol. 2010 Jul;30(13):3176-86. doi: 10.1128/MCB.00214-10. Epub 2010 Apr 26. Mol Cell Biol. 2010. PMID: 20421421 Free PMC article.
-
Expression profiling of the retina of pde6c, a zebrafish model of retinal degeneration.Sci Data. 2017 Dec 12;4:170182. doi: 10.1038/sdata.2017.182. Sci Data. 2017. PMID: 29231925 Free PMC article.
-
Inference on Low-Rank Data Matrices with Applications to Microarray Data.Ann Appl Stat. 2009;3(4):1634-1654. doi: 10.1214/09-AOAS262SUPP. Ann Appl Stat. 2009. PMID: 20508835 Free PMC article.
References
-
- Leung YF, Cavalieri D. Fundamentals of cDNA microarray data analysis. Trends Genet. 2003;19:649–659. - PubMed
-
- Montgomery DC. Design and Analysis of Experiments. 6th Ed. Hoboken, NJ: Wiley; 2005.
-
- Wu C-F, Hamada M. Experiments: Planning, Analysis, and Parameter Design Optimization. New York: Wiley; 2000.
-
- Livesey FJ, Cepko CL. Vertebrate neural cell-fate determination: Lessons from the retina. Nat Rev Neurosci. 2001;2:109–118. - PubMed
-
- Agathocleous M, Harris WA. Cell determination. In: Sernagor E, Eglen S, Harris B, Wong R, editors. Retinal Development. Cambridge: Cambridge Univ Press; 2006. pp. 75–98.
Publication types
MeSH terms
Substances
Associated data
- Actions
Grants and funding
LinkOut - more resources
Full Text Sources
Molecular Biology Databases
Miscellaneous

