. 2008 Sep 2;105(35):12979-84.
doi: 10.1073/pnas.0806437105. Epub 2008 Aug 27.

Frequent switching of Polycomb repressive marks and DNA hypermethylation in the PC3 prostate cancer cell line

Affiliations

Frequent switching of Polycomb repressive marks and DNA hypermethylation in the PC3 prostate cancer cell line

Einav Nili Gal-Yam et al. Proc Natl Acad Sci U S A. .

Abstract

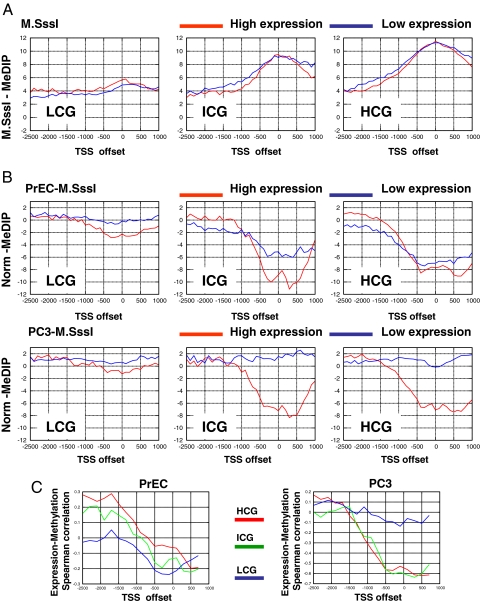
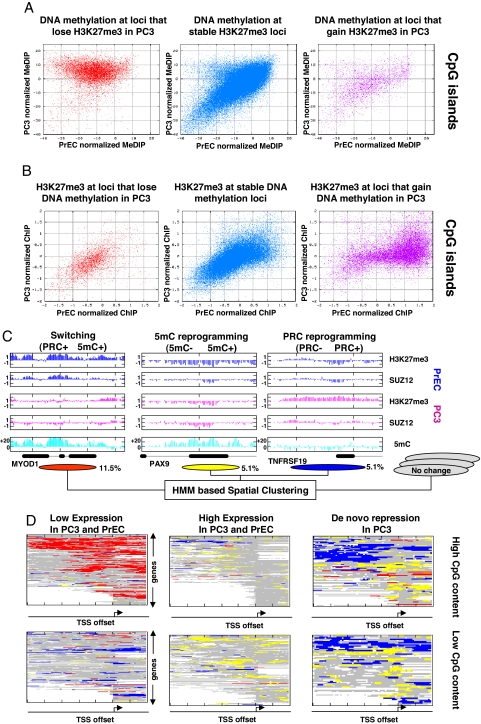
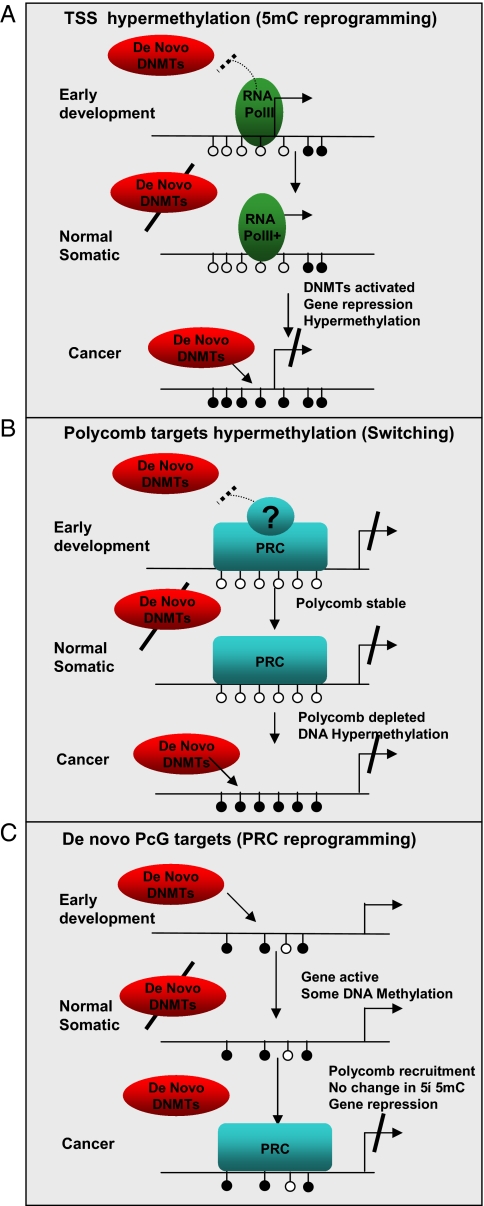
Epigenetic reprogramming is commonly observed in cancer, and is hypothesized to involve multiple mechanisms, including DNA methylation and Polycomb repressive complexes (PRCs). Here we devise a new experimental and analytical strategy using customized high-density tiling arrays to investigate coordinated patterns of gene expression, DNA methylation, and Polycomb marks which differentiate prostate cancer cells from their normal counterparts. Three major changes in the epigenomic landscape distinguish the two cell types. Developmentally significant genes containing CpG islands which are silenced by PRCs in the normal cells acquire DNA methylation silencing and lose their PRC marks (epigenetic switching). Because these genes are normally silent this switch does not cause de novo repression but might significantly reduce epigenetic plasticity. Two other groups of genes are silenced by either de novo DNA methylation without PRC occupancy (5mC reprogramming) or by de novo PRC occupancy without DNA methylation (PRC reprogramming). Our data suggest that the two silencing mechanisms act in parallel to reprogram the cancer epigenome and that DNA hypermethylation may replace Polycomb-based repression near key regulatory genes, possibly reducing their regulatory plasticity.


Conflict of interest statement

The authors declare no conflict of interest.

Figures

Fig. 1.
Fig. 1.
Methylation and gene expression. (A) M.SssI controls. Shown are medians of normalized methylation levels of immunoprecipitated M.SssI-treated DNA in spatial bins relative to the TSSs. We plot separately promoters with three CpG content ranges [high CpG content (HCG), intermediate CpG content (ICG), and low CpG content (LCG)] (19). In each group, we compare genes with high expression (log2 expression >10) to genes with low expression (log2 expression < 7). As expected, the controls show similar methylation capacity for active and inactive genes in each of the three sets. We used the M.SssI data to compensate for the variable CpG content when normalizing MeDIP data. (B) Spatial methylation patterns. Shown are medians of PrEC (Upper) and PC3 (Lower) normalized methylation values in spatial bins relative to the TSSs. The normal cells show activity-dependent lack of methylation near the start site in LCGs and to a lesser extent in ICGs. Cancer cells show methylation associated with inactivity in all CpG content ranges. (C) Expression–methylation correlation. Shown are Spearman correlation coefficients computed between methylation in bins of 200 bp relative to the TSS and gene expression. The graphs confirm the negative correlation between methylation and expression at low CpG-content TSSs in both cell types. The data also demonstrate the strong methylation–expression negative correlation at high CpG-content promoters established in the cancer cells.
Fig. 2.
Fig. 2.
Gain and loss of Polycomb marks in PC3 cells. (A) PRC components and marks in NCCIT, PC3, and PrEC cells. Shown are Western blot results, depicting the levels of SUZ12, EZH2, and H3K27me3 in PrEC, PC3, and reference NCCIT (germ cell tumor) cells. Levels of these enzymes and the H3K27me3 mark are high in PC3, comparable to the levels in the pluripotent, undifferentiated NCCIT cells. Polycomb components and marks in PrEC cells are considerably lower, although still expressed. (B) Gain and loss of H3K27me3/SUZ12 in PC3 cells. Two genomic regions are shown. The FAM58A region demonstrates gain of PRC marks in PC3 together with minimal change in DNA methylation. The PAX7 region is depleted of PRC marks in PC3, and gains extensive DNA hypermethylation.
Fig. 3.
Fig. 3.
Epigenetic switching and reprogramming. (A) Differential DNA methylation as a function of H3K27me3 changes. Shown are normalized PrEC (x-axis) and PC3 (y-axis) MeDIP values for probes that reflect a twofold decrease (Left), no change (Center), or a twofold increase (Right) of their H3K27me3 occupancy in PC3 relative to PrECs. H3K27me3 depletion implies hypermethylation in 90% of the cases (Left). Data are shown for probes in CpG islands only; see Fig. S6 for the trends in low CpG-content regions. (B) Differential H3K27me3 as a function of DNA methylation changes. Shown are PrEC (x-axis) and PC3 (y-axis) H3K27me3 values for CpG island probes that reflect DNA hypomethylation (>10 normalized MeDIP units, Left), unchanged DNA methylation (Center), and DNA hypermethylation (>15 normalized MeDIP units, Right). Depletion of H3K27me3 marks is observed for a significant fraction, but not all of the hypermethylated loci. See Fig. S6 for data on non-CpG island probes. (C) Trends of epigenetic switching and reprogramming. To generalize probabilistically the observations shown in the above scatter plots, and to integrate information from adjacent probes, we developed a new HMM-based algorithm that assigned each probe on the array to an epigenetic mode (Methods and Figs. S7 and S8). Shown are genomic examples for three modes of epigenetic change that were identified in the scatter plots and confirmed by the algorithm. Regions that lose PRC marks and gain DNA methylation in PC3 are defined as switching loci. Regions that gain either PRC marks or 5mC marks independently in PC3 are defined as PRC- or 5mC-reprogramming loci, respectively. The percentage of probes on the array that were annotated as part of each of the three modes is shown below the genomic examples; note that these do not necessarily represent the genomic percentages because CpG islands are overrepresented on the array. (D) Functional analysis of spatial epigenetic modes. Shown are genes' promoters (rows) color coded according to the epigenetic modes associated with them (red, switching; blue, PRC reprogramming; yellow, 5mC reprogramming). We plot data for distinct groups of promoters with high (Upper) and low (Lower) CpG contents and different expression properties (Methods). White boxes represent missing data (at repetitive sequences or promoters that were only partially covered on our array). The data show that epigenetic switching is a dominant effect at high CpG-content promoters that have constitutively low expression in PrEC and PC3 cells. Loci that are subject to PRC and 5mC reprogramming are enriched at genes that are de novo repressed in PC3.
Fig. 4.
Fig. 4.
Model for DNA methylation and PRC recruitment. Shown are schematic promoters. Arrows represent transcription; filled (empty) circles represent methylated (unmethylated) CpG loci. (A and B) A schematic model for passive DNA methylation in PC3 cells. According to the model, the methylation system blindly methylates all CpGs that are not physically masked from it. Two possible masking mechanisms are shown, the first involving transcription initiation complexes (RNA PolII and related chromatin marks) around the TSS of active genes, and the second involves PRCs. Masking is effective only when the de novo DNA methylation machinery is active, either early in development [where masking decreases evolutionary CpG loss and contributes to the emergence of CpG islands (16)], or as part of an aberrant regulatory program in cancer. The experimental observations supporting this model include the sweeping hypermethylation at silenced TSSs in PC3 (Fig. 1) and the sweeping hypermethylation at loci that lose PRC marks in PC3 (Fig. 3A). An alternative active model for hypermethylation via Polycomb interaction should explain the reduction in PRC marks during or after the establishment of DNA hypermethylation. (C) Transcriptional silencing at de novo PRC targets. De novo PRC occupied regions are found upstream of the TSS of many of the repressed genes we studied, in regions that are not occupied by PRCs in hESCs and that are sometimes DNA methylated. Thus, according to our data, de novo repression of normally active genes in cancer PC3 cells occurs in conjunction with two systems that are spatially nonoverlapping [DNA methylation (A) and PRCs (C)]. Interactions between these two spatially separate mechanisms is possible (in some cases we do observe both over the same promoter), but the associated genes are not those that interact with PRCs in hESCs (panel B), and the regions that acquire PRC marks are physically separated from those that gain DNA methylation.

Similar articles

Cited by

References

    1. Jones PA, Baylin SB. The epigenomics of cancer. Cell. 2007;128:683–692. - PMC - PubMed
    1. Barski A, et al. High-resolution profiling of histone methylations in the human genome. Cell. 2007;129:823–837. - PubMed
    1. Bernstein BE, Meissner A, Lander ES. The mammalian epigenome. Cell. 2007;128:669–681. - PubMed
    1. Sparmann A, van Lohuizen M. Polycomb silencers control cell fate, development and cancer. Nat Rev Cancer. 2006;6:846–856. - PubMed
    1. Bracken AP, Dietrich N, Pasini D, Hansen KH, Helin K. Genome-wide mapping of Polycomb target genes unravels their roles in cell fate transitions. Genes Dev. 2006;20:1123–1136. - PMC - PubMed

Publication types

Associated data