. 2009 Feb;126(2):268-79.
doi: 10.1111/j.1365-2567.2008.02895.x. Epub 2008 Aug 27.

Selective impairment in dendritic cell function and altered antigen-specific CD8+ T-cell responses in diet-induced obese mice infected with influenza virus

Affiliations

Selective impairment in dendritic cell function and altered antigen-specific CD8+ T-cell responses in diet-induced obese mice infected with influenza virus

Alexia G Smith et al. Immunology. 2009 Feb.

Erratum in

  • Immunology. 2009 Mar;126(3):446

Abstract

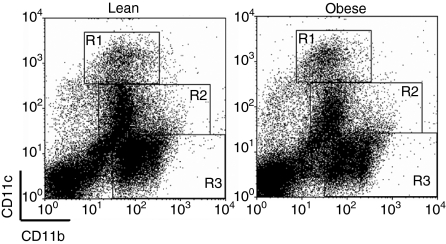
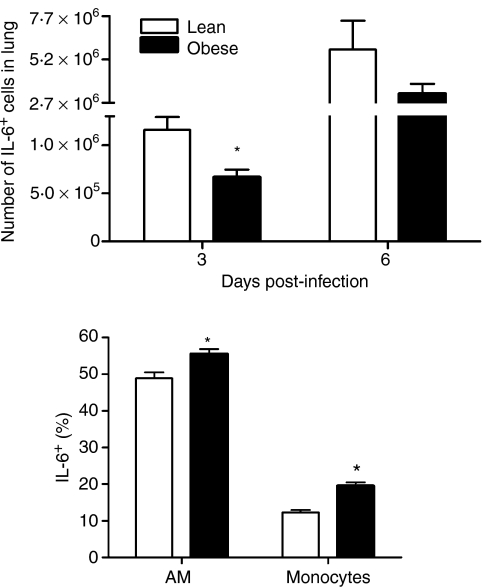
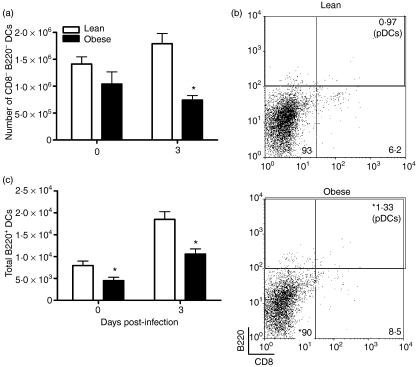
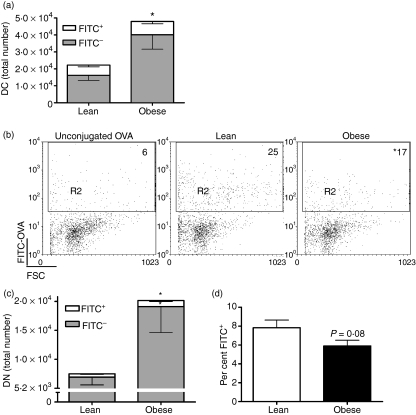
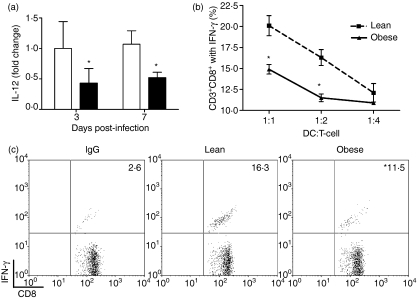
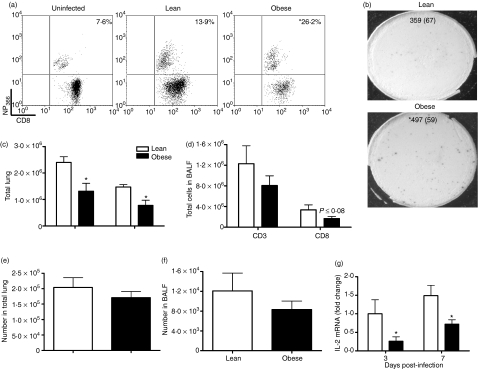
There is a clear link between obesity and metabolic disorders; however, little is known about the effect of obesity on immune function, particularly during an infection. We have previously reported that diet-induced obese mice are more susceptible to morbidity and mortality during influenza infection than lean mice. Obese mice displayed aberrant innate immune responses characterized by minimal induction of interferon (IFN)-alpha/beta, delayed expression of pro-inflammatory cytokines and chemokines, and impaired natural killer cell cytotoxicity. To further examine the abnormal immune response of diet-induced obese mice, we analysed the cellularity of their lungs during influenza virus infection. We found delayed mononuclear cell entry with a marked decrease in dendritic cells (DCs) throughout the infection. Given the critical role of the DC in activating the cell-mediated immune response, we also analysed the functional capacity of DCs from obese mice. We found that, while obesity did not interfere with antigen uptake and migration, it did impair DC antigen presentation. This was probably attributable to an altered cytokine milieu, as interleukin (IL)-2, IL-12, and IL-6 were differentially regulated in the obese mice. Overall, this did not impact the total number of virus-specific CD8(+) T cells that were elicited, but did affect the number and frequency of CD3(+) and CD8(+) T cells in the lung. Thus, obesity interferes with cellular responses during influenza infection, leading to alterations in the T-cell population that ultimately may be detrimental to the host.


Figures

Figure 1
Figure 1
Gating strategy to identify cell populations in lungs. Single-cell suspensions were isolated from whole lung at day 3 post-infection (p.i.) and levels of CD11b and CD11c expression were used to identify alveolar macrophages (R1), dendritic cells (R2) and monocytes/interstitial macrophages (R3).
Figure 2
Figure 2
Interleukin (IL)-6+ cells in the lung during infection. Single-cell suspensions from influenza-infected lungs were surface-stained with anti-CD11b and anti-CD11c following a 4–6-hr incubation with Brefeldin A. (a). Total number of IL-6+ cells in the lung. (b) The per cent IL-6 production at day 3 p.i. was determined for alveolar macrophage (AM) and monocyte populations using the gating strategy described earlier (see Fig. 1). Data are expressed as the mean ± standard error of the mean for five to six animals per group per time-point. *Significantly different from lean mice; P ≤ 0·05.
Figure 3
Figure 3
Population of double-negative (DN) dendritic cells (DCs) and plasmacytoid dendritic cells (pDCs) in the total DC population during influenza virus infection. In the lung, flow cytometry was used to identify the DC subsets within the DC population. (a) Total number of DN DCs in the lung. DN cells were identified as CD8 B220 at days 0 and 3 post-infection (p.i.). Data are expressed as the mean ± standard error of the mean (SEM), with n = 3–6 animals per group. *Significantly different from lean mice; P < 0·05. (b) Gating strategy to identify the proportion of DN DCs and pDCs. Values listed represent the mean percentage in the DC population. The per cent pDCs includes all B220+ cells in the DC gate. *Significantly different from lean mice; P < 0·05 (c) Based on the percentage of pDCs found in (b), the total number of pDCs in the lung was calculated. Data are expressed as the mean ± SEM, with n = 3–6 animals per group. *Significantly different from lean mice; P < 0·05.
Figure 4
Figure 4
Migration of lung dendritic cells (DCs) to the lymph nodes (LNs). Mice were intranasally instilled with fluorescein isothiocyanate (FITC)-ovalbumin (OVA) or unconjugated OVA (unstained control) and 24 hr later mesenteric lymph nodes (MLNs) were harvested. Flow cytometry was used to analyse the cell populations in the LNs. DCs in the LNs were identified as CD11c+. (a) Total number of FITC+ DCs in the LNs. Data are expressed as the mean ± standard error of the mean (SEM) of three experiments with three to five animals per group per experiment. (b) Percentage of FITC+ cells in the LN DC population. The values presented account for the per cent non-specific staining shown in the first panel and are the mean of three experiments with three to five animals per group per experiment. *P ≤ 0·05. (c) Total number of FITC+ DN DCs. Data are expressed as the mean ± SEM of three experiments with three to five animals per group per experiment. *Significantly different from lean mice; P ≤ 0·05. (d) Percentage of FITC+ DN DCs within the DN DC population. Data are expressed as the mean ± SEM of three experiments with three to five animals per group per experiment. FSC, forward scatter.
Figure 5
Figure 5
Dendritic cells (DCs) from obese mice have impaired stimulatory function. (a) Lymph node (LN) interleukin (IL)-12 mRNA expression was quantified by quantitative reverse transcriptase–polymerase chain reaction (qRT-PCR) using total RNA. Values are normalized to GAPDH and are expressed as the mean fold increase ± standard error of the mean (SEM) over lean controls at day 3 post-infection (p.i.) (n = 6–8 mice per group). *Significantly different from lean mice; P ≤ 0·05. (b) An antigen presentation assay was performed using T cells isolated from spleens of influenza-infected lean mice at day 7 p.i. These cells were incubated with varying numbers of influenza-loaded DCs isolated from spleens of uninfected lean and obese mice for 6 hr. The percentage of interferon (IFN)-γ+ CD8+ T cells in the CD3+ lymphocyte population was determined by intracellular cytokine staining and flow cytometry. Data are expressed as the mean ± SEM and are representative of two separate experiments (n = 4–5 pooled mice per group per experiment). (c) The flow cytometry gating strategy used to determine the percentage of splenic IFN-γ+ CD8+ T cells within the CD8+ T-cell population. The 1 : 2 DC:T-cell ratio is shown. Values presented have been corrected for the per cent non-specific immunoglobulin G (IgG) staining and are representative of two separate experiments (n = 4–5 pooled mice per group per experiment). *P ≤ 0·05.
Figure 6
Figure 6
Increased frequency of antigen-specific CD8+ T cells in lungs of obese mice. (a) Percentage of NP366+ cells in the lung CD8+ T-cell population at day 7 post-infection (p.i.). Lungs were processed into single-cell suspensions, incubated with the DbNP366-PE (ASNENMETM) tetramer, and analysed by flow cytometry. Values presented are means (n = 6–8 per group) that have been corrected for the per cent non-specific NP366 staining shown in the first panel. *P ≤ 0·05. (b) Percentage of antigen-specific CD8+ T cells from bronchoalveolar lavage fluid (BALF) at day 7 p.i. An interferon (IFN)-γ enzyme-linked immunosorbent spot-forming cell assay (ELISPOT) was performed with 104 CD8+ T cells obtained from BALF by negative selection and incubated with 105 influenza-pulsed splenocytes from lean, uninfected mice. Wells containing only splenocytes or T cells were used as negative controls. Values are presented as the mean (standard error of the mean (SEM)). *P ≤ 0·05. (c, d) Flow cytometry was used to enumerate the total numbers of CD3+ and CD8+ cells in (c) the lung and (d) BALF at day 7 p.i. Data are expressed as mean ± SEM (n = 6–8 per group). *Significantly different from lean mice; P ≤ 0·05. (e, f) The total number of antigen-specific CD8+ T cells in (e) the lung and (f) BALF at day 7 p.i. was calculated by multiplying the percentage of antigen-specific CD8+ T cells determined by flow cytometry (a) and ELISPOT (b) by the total number of CD8+ T cells in the CD3+ population (c and d). Data are expressed as mean ± SEM (n = 6–8 per group). *Significantly different from lean mice; P ≤ 0·05. (g) IL-2 mRNA expression was quantified by quantitative reverse transcriptase–polymerase chain reaction (qRT-PCR) using total RNA extracted from lymph nodes (LNs) at days 3 and 7 p.i. Values are normalized to GAPDH and are expressed as fold change from lean mice at day 3 p.i. Values are mean ± SEM; n = 6–8. *Significantly different from lean mice; P ≤ 0·05.

Similar articles

Cited by

References

    1. Vona-Davis L, Howard-McNatt M, Rose DP. Adiposity, type 2 diabetes and the metabolic syndrome in breast cancer. Obes Rev. 2007;8:395–408. - PubMed
    1. Perlemuter GBA, Cassard-Doulcier AM, Naveau S. Nonalcoholic fatty liver disease: from pathogenesis to patient care. Nat Clin Pract Endocrinol Metab. 2007;3:458–69. - PubMed
    1. Norris S, Provo B, Stotts N. Physiology of wound healing and risk factors that impede the healing process. AACN Clin Issues Crit Care Nurs. 1990;1:545–52. - PubMed
    1. Massie J, Heller J, Abitbol J, McPherson D, Garfin S. Postoperative posterior spinal wound infections. Clin Orthop Relat Res. 1992;284:99–108. - PubMed
    1. Eliakim A, Swindt C, Zaldivar F, Casali P, Cooper DM. Reduced tetanus antibody titers in overweight children. Autoimmunity. 2006;39:137–41. - PMC - PubMed

Publication types