Exact model reduction of combinatorial reaction networks
- PMID: 18755034
- PMCID: PMC2570670
- DOI: 10.1186/1752-0509-2-78
Exact model reduction of combinatorial reaction networks
Abstract
Background: Receptors and scaffold proteins usually possess a high number of distinct binding domains inducing the formation of large multiprotein signaling complexes. Due to combinatorial reasons the number of distinguishable species grows exponentially with the number of binding domains and can easily reach several millions. Even by including only a limited number of components and binding domains the resulting models are very large and hardly manageable. A novel model reduction technique allows the significant reduction and modularization of these models.
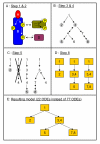
Results: We introduce methods that extend and complete the already introduced approach. For instance, we provide techniques to handle the formation of multi-scaffold complexes as well as receptor dimerization. Furthermore, we discuss a new modeling approach that allows the direct generation of exactly reduced model structures. The developed methods are used to reduce a model of EGF and insulin receptor crosstalk comprising 5,182 ordinary differential equations (ODEs) to a model with 87 ODEs.
Conclusion: The methods, presented in this contribution, significantly enhance the available methods to exactly reduce models of combinatorial reaction networks.
Figures


Similar articles
-
A domain-oriented approach to the reduction of combinatorial complexity in signal transduction networks.BMC Bioinformatics. 2006 Jan 23;7:34. doi: 10.1186/1471-2105-7-34. BMC Bioinformatics. 2006. PMID: 16430778 Free PMC article.
-
Topology of small-world networks of protein-protein complex structures.Bioinformatics. 2005 Apr 15;21(8):1311-5. doi: 10.1093/bioinformatics/bti167. Epub 2005 Jan 19. Bioinformatics. 2005. PMID: 15659419
-
Signaling through receptors and scaffolds: independent interactions reduce combinatorial complexity.Biophys J. 2005 Aug;89(2):951-66. doi: 10.1529/biophysj.105.060533. Epub 2005 May 27. Biophys J. 2005. PMID: 15923229 Free PMC article.
-
Depicting combinatorial complexity with the molecular interaction map notation.Mol Syst Biol. 2006;2:51. doi: 10.1038/msb4100088. Epub 2006 Oct 3. Mol Syst Biol. 2006. PMID: 17016517 Free PMC article. Review.
-
Protein complexes: structure prediction challenges for the 21st century.Curr Opin Struct Biol. 2005 Feb;15(1):15-22. doi: 10.1016/j.sbi.2005.01.012. Curr Opin Struct Biol. 2005. PMID: 15718128 Review.
Cited by
-
Inferring phenomenological models of first passage processes.PLoS Comput Biol. 2021 Mar 5;17(3):e1008740. doi: 10.1371/journal.pcbi.1008740. eCollection 2021 Mar. PLoS Comput Biol. 2021. PMID: 33667218 Free PMC article.
-
Using metabolic networks to predict cross-feeding and competition interactions between microorganisms.Microbiol Spectr. 2024 May 2;12(5):e0228723. doi: 10.1128/spectrum.02287-23. Epub 2024 Mar 20. Microbiol Spectr. 2024. PMID: 38506512 Free PMC article.
-
Spatial rule-based modeling: a method and its application to the human mitotic kinetochore.Cells. 2013 Jul 2;2(3):506-44. doi: 10.3390/cells2030506. Cells. 2013. PMID: 24709796 Free PMC article.
-
ALC: automated reduction of rule-based models.BMC Syst Biol. 2008 Oct 31;2:91. doi: 10.1186/1752-0509-2-91. BMC Syst Biol. 2008. PMID: 18973705 Free PMC article.
-
RuleMonkey: software for stochastic simulation of rule-based models.BMC Bioinformatics. 2010 Jul 30;11:404. doi: 10.1186/1471-2105-11-404. BMC Bioinformatics. 2010. PMID: 20673321 Free PMC article.
References
-
- Hlavacek WS, Faeder JR, Blinov ML, Perelson AS, Goldstein B. The complexity of complexes in signal transduction. Biotechnol Bioeng. 2003;84:783–794. - PubMed
-
- Conzelmann H, Saez-Rodriguez J, Sauter T, Bullinger E, Allgöwer F, Gilles ED. Reduction of mathematical models of signal transduction networks: simulation-based approach applied to EGF receptor signalling. Syst Biol (Stevenage) 2004;1:159–169. - PubMed
-
- Endy D, Brent R. Modelling cellular behaviour. Nature. 2001;409:391–395. - PubMed
-
- Arkin AP. Synthetic cell biology. Curr Opin Biotechnol. 2001;12:638–644. - PubMed
MeSH terms
Substances
LinkOut - more resources
Full Text Sources

