. 2008 Oct 15;586(20):4793-813.
doi: 10.1113/jphysiol.2008.161570. Epub 2008 Aug 28.

Internalized Kv1.5 traffics via Rab-dependent pathways

Affiliations

Internalized Kv1.5 traffics via Rab-dependent pathways

Alireza Dehghani Zadeh et al. J Physiol. .

Erratum in

  • J Physiol. 2009 Jan 15;587(Pt 2):505

Abstract

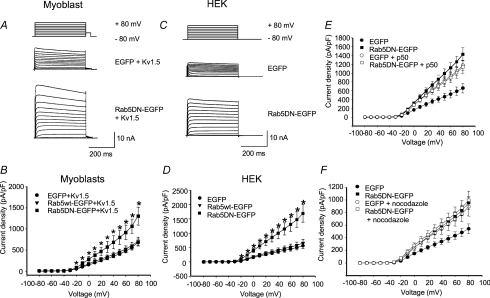
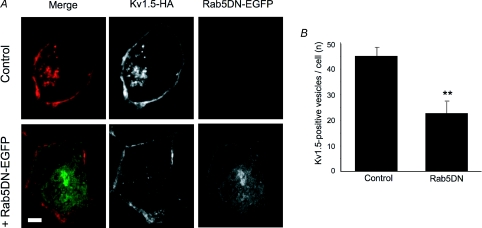
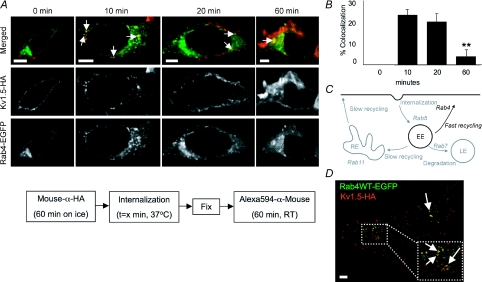
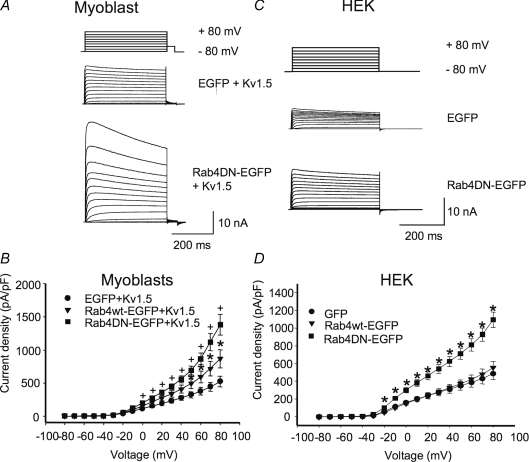
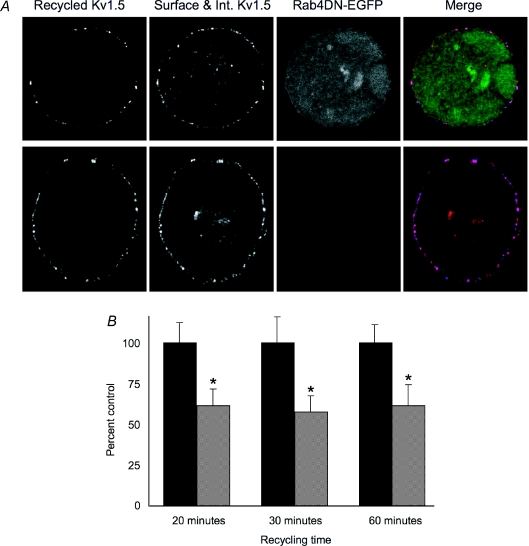
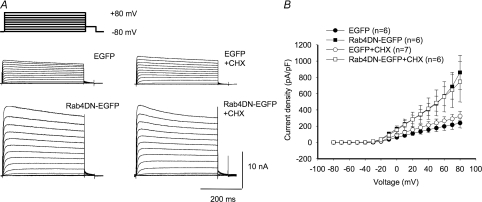
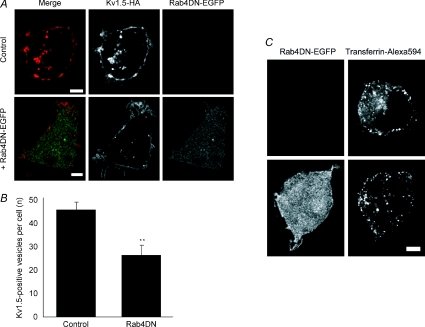
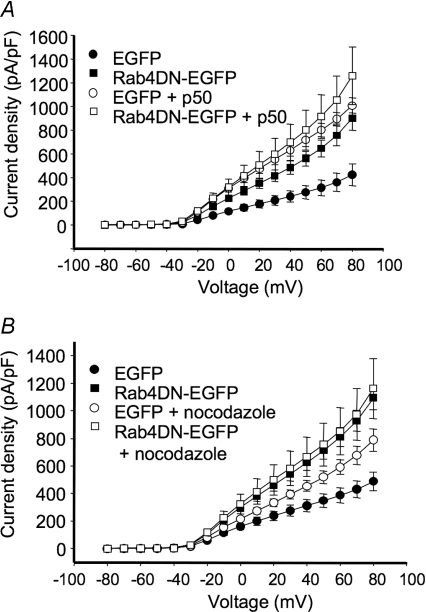
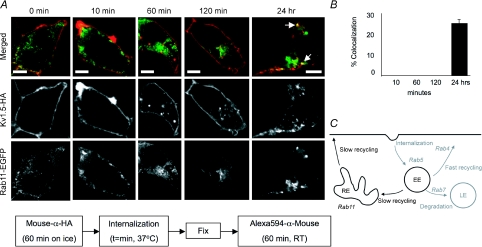
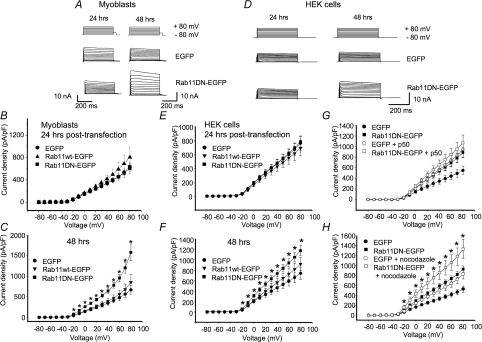
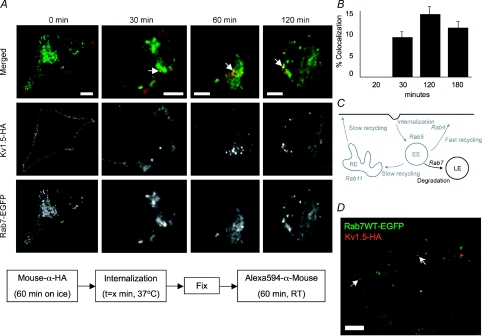
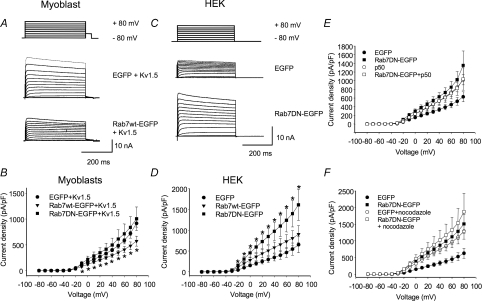
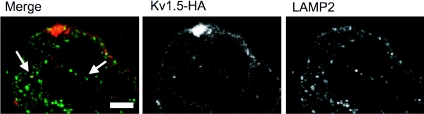
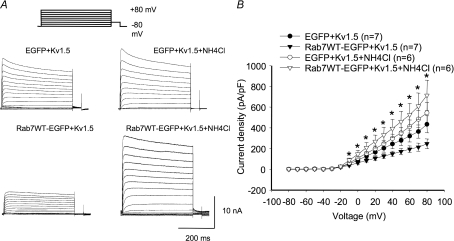
Little is known about the postinternalization trafficking of surface-expressed voltage-gated potassium channels. Here, for the first time, we investigate into which of four major trafficking pathways a voltage-gated potassium channel is targeted after internalization. In both a cardiac myoblast cell line and in HEK293 cells, channels were found to internalize and to recycle quickly. Upon internalization, Kv1.5 rapidly associated with Rab5-and Rab4-positive endosomes, suggesting that the channel is internalized via a Rab5-dependent pathway and rapidly targeted for recycling to the plasma membrane. Nevertheless, as indicated by colocalization with Rab7, a fraction of the channels are targeted for degradation. Recycling through perinuclear endosomes is limited; colocalization with Rab11 was evident only after 24 h postsurface labelling. Expression of dominant negative (DN) Rab constructs significantly increased Kv1.5 functional expression. In the myoblast line, Rab5DN increased Kv1.5 current densities to 1305 +/- 213 pA pF(-1) from control 675 +/- 81.6 pA pF(-1). Rab4DN similarly increased Kv1.5 currents to 1382 +/- 155 pA pF(-1) from the control 522 +/- 82.7 pA pF(-1) at +80 mV. Expression of the Rab7DN increased Kv1.5 currents 2.5-fold in HEK293 cells but had no significant effect in H9c2 myoblasts, and, unlike the other Rab GTPases tested, over-expression of wild-type Rab7 decreased Kv1.5 currents in the myoblast line. Densities fell to 573 +/- 96.3 pA pF(-1) from the control 869 +/- 135.5 pA pF(-1). The Rab11DN was slow to affect Kv1.5 currents but had comparable effects to other dominant negative constructs after 48 h. With the exception of Rab11DN and nocodazole, the effects of interference with microtubule-dependent trafficking by nocodazole or p50 overexpression were not additive with the Rab dominant negatives. The Rab GTPases thus constitute dynamic targets by which cells may modulate Kv1.5 functional expression.


Figures

Figure 1
Figure 1. Dynamics of Kv1.5-HA mobility in HEK293 cells
A, Kv1.5-HA labelled by indirect fluorescence staining of live cells is restricted initially to the cell surface (time 0, left) and internalizes rapidly in vesicle-like structures (time 5 and 11 min, middle and right). B, variable mobility of internalized Kv1.5-containing vesicles. The highlighted vesicle exhibits retrograde (time 0–6 min) then anterograde movement (time 10–14 min). Scale bar = 5 μm.
Figure 2
Figure 2. Internalized Kv1.5 rapidly recycles to the plasma membrane
A, schematic representation of the recycling assay protocol. HEK293 cells stably expressing Kv1.5-HA were incubated with mouse anti-HA to tag the surface-expressed channels. Cells were then given 30 min to internalize surface channel thereafter labelled on ice to saturation with Rhodamine Red-X-conjgated anti-mouse to label all remaining anti-HA tagged surface Kv1.5-HA and to block binding of the Alexa Fluor 488-conjugated anti-HA antibody used in the following step. Cells were then incubated for the indicated times to allow recycling, labelled with Alexa Fluor 488-conjugated anti-mouse on ice to detect channels that had recycled to the plasma membrane, then fixed and mounted. B, upper panels, Alexa Fluor 488 fluorescence after various recycling times. Recycled Kv1.5-HA is absent on the membrane at 0 min. Binding of Alexa Fluor 488-conjugated antibody, indicative of recycled channels, is evident beginning at 10 min and, in increasing amounts, at all subsequent time points. Middle panels, Rhodamine Red-X fluorescence at the same time points. Surface staining is robust at all times. Fluorescence is apparent also in vesicular compartments at later time points, indicative of continued internalization of the channel. Lower panels, merged images showing combined Rhodamine Red-X and Alexa488 fluorescence (recycled Kv1.5-HA) at the indicated time points. Recycled channel colocalizes with Rhodamine Red-X-labelled channels and therefore appears yellow in these images. C, botulinum toxin reduces recycling of Kv1.5. Recycling is assayed as Alexa Fluor 488 fluorescence as in B above. The recycling assay was performed as described in Methods in the presence (right panels) or absence (left panels) of 10 nm botulinum toxin C after 30 min recycling time. Scale bar = 5 μm.
Figure 3
Figure 3. Kv1.5 colocalizes rapidly with the Rab5 GTPase in HEK293 cells and H9c2 myoblasts
A, time series of internalized Kv1.5 colocalization with Rab5. Upper panels, merged Rab5-EGFP and Kv1.5-HA associated fluorescence at the indicated time points. The arrows highlight some of the vesicles in which Kv1.5 and Rab5 are seen to colocalize. Middle panels, Kv1.5-HA associated Alexa Fluor 594 fluorescence alone. Only channels that were present at the cell surface at the beginning of the experiment are labelled. Lower panels, Rab5-EGFP fluorescence alone. The schematic diagram below outlines the protocol employed in these experiments. B, quantification of Rab5 colocalization in Kv1.5-positive vesicles. Percentage colocalization was calculated from the fraction of Kv1.5 positive vesicles in the imaged cells that were found to exhibit also tagged-Rab5 EGFP fluorescence. **P < 0.01, one-way ANOVA. C, schematic representation of the roles of Rab5, Rab4, Rab11 and Rab7 in membrane protein endocytosis and recycling. The Rab5-dependent steps are highlighted in this figure. EE, early endosome; RE, recycling endosome; LE, late endosome. D, Kv1.5-HA and Rab5-EGFP colocalize in H9c2 cells after 20 min internalization time. Experimental protocol was as in A. Arrows in the magnified inset highlight some of the vesicles in which Kv1.5 and Rab5 are seen to colocalize. Scale bar = 5 μm
Figure 4
Figure 4. Effect of Rab5 wild-type overexpression and Rab5 dominant negative (Rab5DN) expression on Kv1.5 current
Cells were depolarized from −80 to +80 mV in 10 mV, 500 ms steps). H9c2 cells were repolarized to −40 mV for 50 ms then to −80 mV and HEK293 cells were repolarized directly to −80 mV between pulses. Data are represented as means ±s.e.m. Current densities from control cells (EGFP), Rab5-EGFP and Rab5DN-EGFP transfected cells are plotted against voltage. A and C, sample traces of control and Rab5DN-transfected H9c2 and HEK293 cells, respectively. The HEK293 line stably expresses Kv1.5; H9c2 cells were cotransfected with Kv1.5-mCherry. B and D, current density versus voltage plot for data recorded 24 h post-transfection for H9c2 and HEK293 cells, respectively. E, effect of p50/dynamitin overexpression on Kv1.5 current density in control and Rab5DN-coexpressing HEK293 cells. Current recordings were performed 36–48 h post-transfection. F, current densities of control cells and Rab5DN-EGFP transfected cells with or without nocodazole treatment are plotted against voltage. Nocodazole-treated cells were incubated with 35 μm nocodazole for 6 h prior to electrophysiological recording. *P < 0.05, one-way ANOVA.
Figure 5
Figure 5. Co-expression of Rab5DN reduces Kv1.5 internalization
A, representative images showing internalized Kv1.5-HA (red; Alexa Fluor 594-conjugated) positive vesicles in control (upper panels) and Rab5DN-EGFP-transfected cells (lower panels). Only channels that were present at the cell surface at the beginning of the experiment are labelled. The number of Kv1.5-positive internalized vesicles is noticeably lower in the Rab5DN-expressing cells (middle panel, lower) than in the control, untransfected cells. Scale bar = 5 μm. B, number of Kv1.5-positive vesicles per cell under control conditions and when Rab5DN is coexpressed. **P < 0.01, Student's t test.
Figure 6
Figure 6. Kv1.5-HA colocalization with Rab4
A, time series of Kv1.5 colocalization with Rab4. Upper panels, merged Rab4-EGFP and Kv1.5-HA associated fluorescence at the indicated time points. The arrows highlight some of the vesicles in which Kv1.5 and Rab4 are seen to colocalize. Middle panels, Kv1.5-HA associated Alexa594 fluorescence alone. Only channels present at the beginning of the experiment are labelled. Lower panels, Rab4-EGFP fluorescence alone. The experimental protocol is outlined schematically below the images. Scale bar = 5 μm. B, percentage colocalization of Rab4 in Kv1.5-positive vesicles. Percentage colocalization was calculated from the fraction of Kv1.5 positive vesicles in the imaged cells that were found to exhibit tagged-Rab4 EGFP fluorescence also. C, Rab4-dependent steps highlighted in Rab-dependent pathway schematic diagram. EE, early endosome; RE, recycling endosome; LE, late endosome. D, Kv1.5-HA and Rab4-EGFP colocalize in H9c2 cells after 20 min internalization time. The arrows point to some of the vesicles in which colocalization is evident. **P < 0.01, one-way ANOVA.
Figure 7
Figure 7. Rab4DN significantly increases Kv1.5 current density 24 h post-transfection
The electrophysiological protocols were as described in Fig. 4. Data are represented as means ±s.e.m.A and C, sample traces of control and Rab4DN-transfected H9c2 and HEK293 cells, respectively. The HEK293 line stably expresses Kv1.5; H9c2 cells were cotransfected with Kv1.5-mCherry. B and D, current–voltage plots for data recorded 24 h post-transfection for H9c2 and HEK293 cells, respectively. +P < 0.01, *P < 0.5, one-way ANOVA.
Figure 8
Figure 8. Co-expression of Rab4DN reduces Kv1.5 recycling
The recycling assay was as described for Fig. 2 with the exception that the experimental cells were transfected with pcDNA3-Rab4DN-EGFP and the recycled Kv1.5-HA was detected with Alexa Fluor 647 conjugated goat anti-mouse. A, representative images showing recycled Kv1.5-HA (blue, Alexa Fluor 647-conjugated) at the membrane and surface and internalized Kv1.5 (red, Rhodamine Red-X conjugated) in control, untransfected cells (upper panels) and in Rab4DN-EGFP expressing cells after 30 min recycling time (lower panels). Scale bar = 5 μm. B, relative pixel intensities of Alexa647 fluorescence (indicative of recycled Kv1.5) at the cell membrane under control conditions (dark bars) and when Rab4DN is coexpressed (light bars) at the indicated time points. Values are normalized to the control (untransfected) pixel intensities at each time point. Sample sizes for each time point are as follows: 20 min: Control n= 15, Rab4DN n= 10; 30 min: Control n= 13, Rab4DN n= 11; 60 min: Control n= 6, Rab4DN n= 7. *P < 0.05, Student's t test.
Figure 9
Figure 9. Cycloheximide does not affect Rab4DN-mediated increase in Kv1.5 expression
A, sample traces of control and Rab4DN-transfected HEK293 cells ± cycloheximide. The HEK293 line stably expresses Kv1.5. Cycloheximide-treated cells were treated with 100 μg/ml cycloheximide for 6 h immediately prior to electrophysiological recording. B, current–voltage plots for data recorded 36–48 h post-transfection.
Figure 10
Figure 10. Co-expression of Rab4DN reduces Kv1.5 internalization
A, representative images showing internalized Kv1.5-HA positive vesicles in control (upper panels) and in Rab4DN-EGFP-transfected cells (lower panels). Kv1.5-HA is detected with Alexa Fluor 594 (red) and Rab5DN-EGFP is detected by EGFP (green) fluorescence. Only channels that were present at the cell surface at the beginning of the experiment are labelled. B, Number of Kv1.5-positive vesicles per cell under control conditions and when Rab4DN is coexpressed. **P < 0.01, Student's t test. C, representative images showing internalized transferrin conjugated to Alexa Fluor 594 in control, untransfected cells (upper panels) and in Rab4DN-EGFP-transfected cells after 5 min internalization time. Scale bars = 5 μm.
Figure 11
Figure 11. Effects of Rab4DN and interference with microtubule-dependent trafficking are not additive
Electrophysiological protocols were as described in Fig. 4. Data are represented as means ±s.e.m.A, effect of p50/dynamitin overexpression on Kv1.5 current density in control and Rab4DN-coexpressing HEK293 cells. Current recordings were performed 36–48 h post-transfection. B, current densities of control cells and Rab4DN-EGFP transfected cells with or without nocodazole treatment are plotted against voltage. Nocodazole-treated cells were incubated with 35 μm nocodazole for 6 h prior to electrophysiological recording.
Figure 12
Figure 12. Kv1.5 colocalizes with Rab11 only after prolonged internalization times
A, time series of Kv1.5 colocalization with Rab11. Upper panels, merged Rab11-EGFP and Kv1.5-HA associated fluorescence at the indicated time points. The arrows highlight some of the vesicles in which Kv1.5 (red) and Rab11 (green) are seen to colocalize (yellow). Middle panels, Kv1.5-HA associated Alexa Fluor 594 fluorescence alone. Only channels that were present at the cell surface at the beginning of the experiment are labelled. Lower panels, Rab11-EGFP fluorescence alone. The schematic below outlines the protocol employed in these experiments. Scale bar = 5 μm. B, percentage colocalization of Rab11 in Kv1.5-positive vesicles. C, Rab11-dependent steps highlighted in Rab-dependent pathway schematic diagram. EE, early endosome; RE, recycling endosome; LE, late endosome.
Figure 13
Figure 13. Rab11DN affects Kv1.5 currents only late after transfection
The electrophysiological protocols were as described in Fig. 4. Data are represented as means ±s.e.m.A and D, sample traces for data recorded 24 and 48 h post-transfection in H9c2 cells and HEK293 cells, respectively. The HEK293 line stably expresses Kv1.5; H9c2 cells were cotransfected with Kv1.5-mCherry. B and E, current density plots for data recorded 24 h post-transfection from H9c2 and HEK293 cells, respectively. C and F, current density plots recorded 48 h post-transfection from H9c2 and HEK293 cells, respectively. G, effect of p50/dynamitin overexpression on Kv1.5 current density in HEK293 cells. Current recordings were performed 48 h post-transfection. H, current densities, 48 h post-transfection, of control cells and Rab11DN-EGFP transfected HEK293 cells with or without nocodazole treatment are plotted against voltage. Nocodazole-treated cells were incubated with 35 μm nocodazole for 6 h prior to electrophysiological recording. *P < 0.05, one-way ANOVA.
Figure 14
Figure 14. Kv1.5 colocalizes with Rab7 within 1 h of internalization
A, time series of internalized Kv1.5 colocalization with Rab7. The schematic diagram below outlines the protocol employed in these experiments. Upper panels, merged Rab7-EGFP and Kv1.5HA associated fluorescence at the indicated time points. The arrows highlight some of the vesicles in which Kv1.5 (red) and Rab7 (green) are seen to colocalize (yellow). Middle panels, Kv1.5-HA associated Alexa Fluor 594 fluorescence alone. Only channels that were present at the cell surface at the beginning of the experiment are labelled. Lower panels, Rab7-EGFP fluorescence alone. Scale bar = 5 μm. B, quantification of Rab7 colocalization in Kv1.5-positive vesicles. Percentage colocalization was calculated from the fraction of Kv1.5 positive vesicles in the imaged cells that were found to exhibit also tagged-Rab7 EGFP fluorescence. C, Rab7-dependent steps highlighted in Rab-dependent pathway schematic diagram. EE, early endosome; RE, recycling endosome; LE, late endosome. D, Kv1.5-HA and Rab7-EGFP colocalize in H9c2 cells after 20 min internalization time.
Figure 15
Figure 15. Rab7 wild-type and dominant negatives affect Kv1.5 functional expression
Electrophysiological protocols were as described in Fig. 4. Data are represented as means ±s.e.m.A and C, sample traces for data recorded 24 h post-transfection in H9c2 cells and HEK293 cells, respectively. The HEK293 line stably expresses Kv1.5; H9c2 cells were cotransfected with Kv1.5-mCherry. B and D, current density plots for data recorded 24 h post-transfection from H9c2 and HEK293 cells, respectively. E, effect of p50/dynamitin overexpression Kv1.5 current density in HEK293 cells coexpressing Rab7 EGFP fusions. Current recordings were performed 36–48 h post-transfection. F, current densities of control cells and Rab7 wild-type and Rab7DN-EGFP transfected HEK293 cells with or without nocodazole treatment are plotted against voltage. Nocodazole-treated cells were incubated with 35 μm nocodazole for 6 h prior to electrophysiological recording. *P < 0.05, one-way ANOVA.
Figure 16
Figure 16. Kv1.5 colocalizes with LAMP2, a lysosomal marker
Representative images showing internalized Kv1.5-HA (Alexa Fluor 594, red) and LAMP2 (Alexa Fluor 488, green) staining in HEK293 cells stably expressing Kv1.5-HA. Only channels that were present at the cell surface at the beginning of the experiment are labelled. The arrows highlight some of the vesicles in which Kv1.5 (red) and LAMP2 (green) are seen to colocalize (yellow). Scale bar = 5 μm.
Figure 17
Figure 17. Ammonium chloride prevents Rab7-associated decrease in H9c2 cell Kv1.5 expression
A, sample traces of control and Rab4DN-transfected H9c2 cells ± ammonium chloride. H9c2 cells were treated with 50 mm ammonium chloride for 6 h immediately prior to electrophysiological recording. B, current–voltage plots for data recorded 36–48 h post-transfection. *P < 0.05, comparing Rab7 wild-type over-expressing cells ± ammonium chloride.

Similar articles

Cited by

References

    1. Bucci C, Parton RG, Mather IH, Stunnenberg H, Simons K, Hoflack B, Zerial M. The small GTPase Rab5 functions as a regulatory factor in the early endocytic pathway. Cell. 1992;70:715–728. - PubMed
    1. Burkhardt JK, Echeverri CJ, Nilsson T, Vallee RB. Overexpression of the dynamitin (p50) subunit of the dynactin complex disrupts dynein-dependent maintenance of membrane organelle distribution. J Cell Biol. 1997;139:469–484. - PMC - PubMed
    1. Bush J, Temesvari L, Rodriguez-Paris J, Buczynski G, Cardelli J. A role for a Rab4-like GTPase in endocytosis and in regulation of contractile vacuole structure and function in Dictyostelium discoideum. Mol Biol Cell. 1996;7:1623–1638. - PMC - PubMed
    1. Choi WS, Khurana A, Mathur R, Viswanathan V, Steele DF, Fedida D. Kv1.5 surface expression is modulated by retrograde trafficking of newly endocytosed channels by the dynein motor. Circ Res. 2005;97:363–371. - PubMed
    1. Christoforidis S, McBride HM, Burgoyne RD, Zerial M. The Rab5 effector EEA1 is a core component of endosome docking. Nature. 1999;397:621–625. - PubMed

Publication types

MeSH terms

Substances