. 2008 Oct 15;586(20):4825-42.
doi: 10.1113/jphysiol.2008.158709. Epub 2008 Aug 28.

Molecular mechanisms supporting a paracrine role of GABA in rat adrenal medullary cells

Affiliations

Molecular mechanisms supporting a paracrine role of GABA in rat adrenal medullary cells

Hidetada Matsuoka et al. J Physiol. .

Abstract

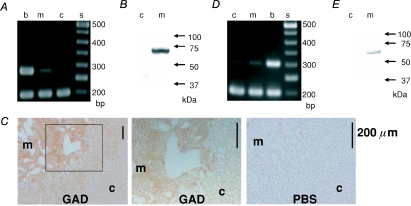
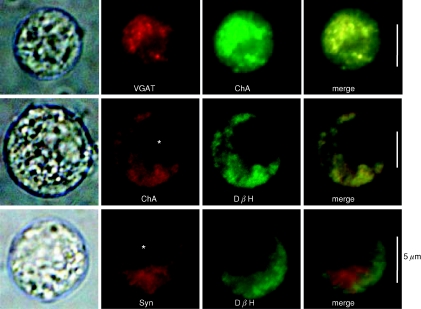
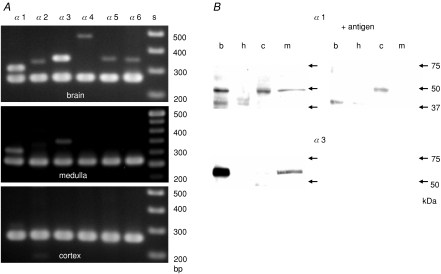
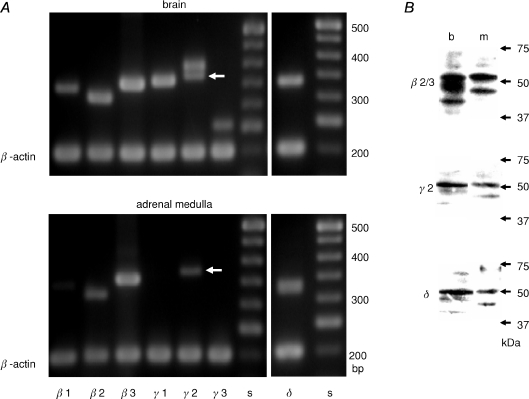
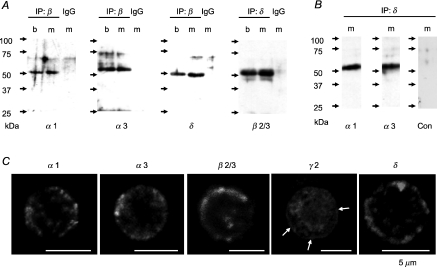
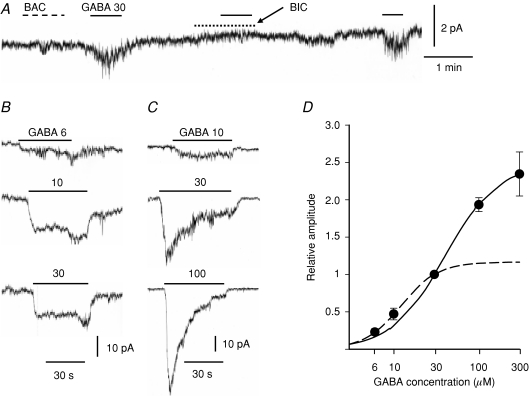
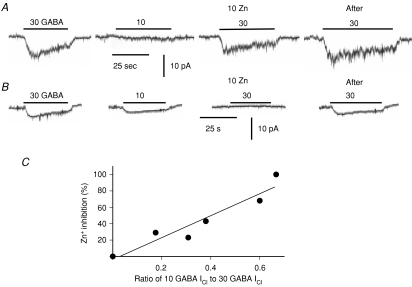
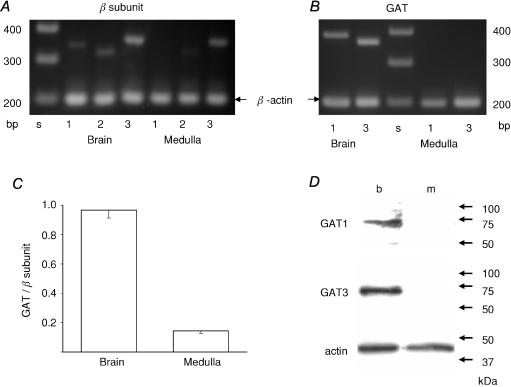
GABA is known to produce membrane depolarization and secretion in adrenal medullary (AM) cells in various species. However, whether the GABAergic system is intrinsic or extrinsic or both in the adrenal medulla and the role that GABA plays are controversial. Therefore, these issues were addressed by combining a biochemical and functional analysis. Glutamic acid decarboxylase (GAD), a GABA synthesizing enzyme, and vesicular GABA transporter (VGAT) were expressed in rat AM cells at the mRNA and protein levels, and the adrenal medulla had no nerve fibre-like structures immunoreactive to an anti-GAD Ab. The double staining for VGAT and chromogranin A indicates that GABA was stored in chromaffin granules. The alpha1, alpha3, beta2/3, gamma2 and delta subunits of GABA(A) receptors were identified in AM cells at the mRNA and protein levels. Pharmacological properties of GABA-induced Cl(-) currents, immunoprecipitation experiments and immunocytochemistry indicated the expression of not only gamma2-, but also delta-containing GABA(A) receptors, which have higher affinities for GABA and neurosteroids. Expression of GATs, which are involved in the clearance of GABA at GABAergic synapses, were conspicuously suppressed in the adrenal medulla, compared with expression levels of GABA(A) receptors. Increases in Ca(2+) signal in AM cells evoked trans-synaptically by nerve stimulation were suppressed during the response to GABA, and this suppression was attributed to the shunt effect of the GABA-induced increase in conductance. Overall Ca(2+) responses to electrical stimulation and GABA in AM cells were larger or smaller than those to electrical stimulation alone, depending on the frequency of stimulation. The results indicate that GABA functions as a paracrine in rat AM cells and this function may be supported by the suppression of GAT expression and the expression of not only gamma2-, but also delta-GABA(A) receptors.


Figures

Figure 1
Figure 1. The presence of GAD67 and VGAT in rat AM cells
A, electrophoresis of PCR products for GAD67 and β-actin. The PCR product of 280 bp for GAD67 was clearly observed in cDNA samples of the rat brain (b) and adrenal medulla (m), but not in those of the adrenal cortex (c), whereas the 198 bp PCR products for β-actin were observed at similar levels in all three tissues. s stands for standard ladder of DNAs in this and following figures. B, immunoblot for GAD. A band of 65–67 kDa was detected in a homogenate of rat adrenal medulla, but not adrenal cortex. C, immunohistochemistry for GAD. Sections of rat adrenal glands were incubated overnight in PBS with (GAD) and without (PBS) a rabbit anti-GAD Ab. The immunoreaction was detected with the indirect immunoperoxidase method. The middle panel represents an enlargement of the area indicated by the square in the left panel. D, electrophoresis of PCR products for VGAT and β-actin. PCR products of 303 bp were clearly observed in cDNAs of the rat adrenal medulla (m) and brain (b) and faintly in those of the adrenal cortex (c). The lower bands represent PCR product of 198 bp for β-actin as an internal control. E, immunoblot for VGAT. A band of about 60 kDa was detected in a homogenate of rat adrenal medulla, but not adrenal cortex.
Figure 2
Figure 2. The presence of VGAT in chromaffin granules
1st column represents transparent images for each rat AM cell; the 2nd and 3rd columns show rhodamine-like and FITC-like fluorescence images for immunoreaction. 4th column indicates merge of the 2nd and 3rd column images. Colocalization of immunoreactions with different Abs is shown in yellow. Cells were treated with a rabbit anti-VGAT Ab and then with goat anti-chromogranin A (ChA) or with rabbit anti-dopamine-β-hydroxylase (DβH) and then the anti-ChA Ab or a mouse anti-synaptophysin (Syn) mAb. Asterisks indicate the nucleus. The experiments were repeated at least three times.
Figure 3
Figure 3. The presence of α1 and α3 subunits of GABAA receptors in rat adrenal medulla
A, electrophoresis of PCR products of rat brain, adrenal medulla and adrenal cortex cDNAs for α1, α2, α3, α4, α5 and α6 subunits of GABAA receptors and β-actin. PCR products of 304, 333, 351, 478, 338 and 348 bp for α1, α2, α3, α4, α5 and α6 subunits, respectively, were observed in the brain samples, whereas 304 and 351 bp for α1 and α3 subunits were observed in the adrenal medulla. None of the PCR products for the six α subunits were detected in the adrenal cortex. The lower bands represent PCR products of 261 bp for β-actin. B, immunoblots for α1 and α3 subunits with and without pre-absorption of Abs by antigens. b, h, c and m stand for homogenates of rat brain, heart, adrenal cortex and adrenal medulla. Alomone-produced Abs were used with or without each antigen peptide. The same amount of proteins (6 μg) was loaded for each lane.
Figure 4
Figure 4. The presence of β2/3, γ2 and δ subunits in rat adrenal medulla
A, electrophoresis of PCR products of rat brain and adrenal medulla cDNAs for β1, β2, β3, γ1, γ2S (arrows), γ2L, γ3, and δ subunits and β-actin. PCR products of 341, 317, 355, 360, 374, 398, 255 and 333 bp for β1, β2, β3, γ1, γ2S, γ2L, γ3 and δ subunits, respectively, were observed in brain cDNAs, whereas β2, β3, γ2S and δ PCR products were observed in adrenal medulla cDNAs. PCR products for β-actin are 198 bp. B, immunoblots for β2/3, γ2 and δ subunits of homogenates of rat brain (b) and adrenal medulla (m). 53 kDa β2/3, 52 kDa γ2 and 50 kDa δ proteins were detected in brain and adrenal medulla by mouse anti-β2/3 mAb (BD17), rabbit anti-γ2 Ab and rabbit anti-δ Ab (Chemicon), respectively.
Figure 5
Figure 5. Immunoprecipitation and immunocytochemistry for GABAA receptors
A, immunoblots for α1, α3, δ and β2/3 of immunocomplexes precipitated with the mouse anti-β2/3 mAb (62-3G1) (IP: β), rabbit anti-δ Ab (Santa Cruz) (IP: δ), or non-immune rabbit IgG (IgG). Immunocomplexes were precipitated from lysates of rat brain (b) and adrenal medulla (m). α1, α3, δ and β2/3 were detected by rabbit anti-α1 Ab, rabbit anti-α3 Ab (provided by W. Sieghart), rabbit anti-δ Ab (Chemicon), and 62-3G1, respectively. B, immunoblots for α1 and α3 of immunocomplexes precipitated with the anti-δ Ab. The immunoprecipitates from lysates of rat medulla (m) were subjected to cross-linking (see Methods). Note that the band of about 50 kDa was not detected with a secondary anti-rabbit IgG Ab alone (Con), indicating that heavy chains of IgG were not eluted from the immunoprecipitates. C, representative fluorescence images of immunostainings for α1, α3, β2/3, γ2 and δ subunits in dissociated rat AM cells. Arrows indicate immunoreactivity at cell periphery. Immunostaining was repeated at least three times.
Figure 6
Figure 6. Dose dependence of GABAA receptor Cl channel activation
A, recording of whole-cell current at −70 mV with the nystatin method. Agents (30 μm baclofen (BAC), 30 μm GABA and 10 μm bicuculline (BIC)) were bath applied during the indicated periods. B and C, recording traces of whole-cell currents in response to GABA at several concentrations. B and C were recorded at −70 mV from different AM cells with the nystatin method. GABA was bath applied during the periods indicated by the bars (values in μm). D, peak amplitudes of GABA-induced ICl are plotted against GABA concentrations. Peak ICls in response to GABA at several concentrations were expressed as fractions of peak ICls evoked by 30 μm GABA in the same AM cells (see Methods). The line represents the logistic equation with an EC50 of 39.49 μm, a Hill coefficient of 1.4, and Imax of 2.47, a equation which best approximated a set of data from 30 to 300 μm. The dashed line represents the logistic equation with an EC50 of 12.25 μm, Hill coefficient of 2.0, and Imax of 1.17, a equation which was obtained in the best fitting of a set of data from 6 to 30 μm. Data represent mean ±s.e.m. (4–15 observations for each point).
Figure 7
Figure 7. Zn2+ inhibition of GABAA receptor ICl
A and B, current traces of whole-cell recordings at −70 mV in different AM cells. GABA at 10 or 30 μm was bath applied during the periods indicated by the bars in the presence (10 Zn) and absence of 10 μm Zn2+ ions. Note that 30 μm GABA-induced ICl was restored after washout of 10 μm Zn2+ (After). C, the extent of Zn2+ inhibition of 30 μm GABA-induced ICl is plotted against ratio of 10 μm GABA-induced ICl to 30 μm GABA-induced ICl. The peak amplitudes of currents in response to 10 and 30 μm GABA were measured in the same cells. The line represents a regression line (r= 0.9505).
Figure 8
Figure 8. Absence of GAT expression in rat adrenal medulla
A, electrophoresis of the PCR products of rat brain and adrenal medulla cDNAs for β1, β2 and β3 subunits, and β-actin. B, electrophoresis of PCR products for GATs and β-actin. C, summary of ratios of totals of the relative amounts of PCR products for GAT1 and GAT3 to those of relative amounts of PCR products for β1, β2 and β3 subunits. The amounts of PCR products for GATs and β subunits were expressed as fractions of the amounts of PCR products for β-actin (see Methods). Data represent mean ±s.e.m. (n= 3). D, immunoblot for GAT1 and GAT3 of homogenates of rat brain (b) and adrenal medulla (m). Immunoblotting for actin was performed to confirm that the same amount of proteins (6 μg) was loaded for each lane.
Figure 9
Figure 9. Inhibitory effects of GABA on trans-synaptically evoked Ca2+ response in rat AM cells
A, confocal images of fluo-4 fluorescence in rat adrenal medulla. The adrenal gland was retrogradely perfused through the adrenal vein with saline (see Methods). GABA at 30 μm was added to the perfusion solution during the indicated period (interrupted line). Nerve fibres remaining in the gland were electrically stimulated with 60 V pulses of 1.5 ms duration at 10 Hz for 30 s during the indicated periods (bars). The adrenal medulla was illuminated with 488 laser and emission of above 510 nm was observed every 5 s. B, relative values of change in fluorescence intensity in the presence and absence of GABA are plotted against time. Fluorescence intensities in the areas (x and y) indicated in Ac were measured and presented as filled (x) and open (y) symbols, respectively. After correction for the decline due to photobleaching, an increase in fluorescence intensity in response to electrical stimulation and GABA was expressed as a fraction of the resting level (see Methods). a, b and c in A correspond to a, b and c in B.
Figure 10
Figure 10. Effects of GABA and muscarine on Ca2+ response to electrical stimulation at various frequencies in rat adrenal medulla
A and B, relative values of change in fluorescence intensity in the presence and absence of 30 μm GABA and muscarine (MUS) are plotted against time, respectively. Changes in fluorescence intensity in several areas were calculated in the same manner as that explained for Fig. 9. Nerve fibres remaining in the gland were electrically stimulated with 60 V pulses of 1.5 ms duration at 0.5, 1 and 5 Hz for 30 s in sequence before, during and after drug application. A and B were obtained from the same preparation. C, extents of decrease in Ca2+ response to electrical stimulation are plotted against values of responses to 30 μm GABA just before electrical stimulation. Electrical stimulation was applied at 0.5 (^), 1 (•), 5 (▴) and 10 Hz (▵). The line represents a regression line (r= 0.8241). D, extent of decrease in Ca2+ response to electrical stimulation at 0.5–10 Hz during application of GABA (•, n= 6 preparations) or muscarine (^, n= 7) are plotted against values of response to GABA or muscarine just before electrical stimulation. E, summary of overall Ca2+ responses to electrical stimulation with and without GABA application. The filled columns represent the maximum of overall Ca2+ response to electrical stimulation and GABA. The open columns represent the maximum of putative Ca2+ response to the electrical stimulation without GABA, a value which is estimated by averaging the maximums of the electrically evoked Ca2+ responses before and after GABA application. The maximums of such Ca2+ responses with and without GABA application are expressed as a fraction of Ca2+ response to electrical stimulation at each frequency before GABA application. * and ** represent statistical significance (Student's paired t test) of P < 0.05 and P < 0.005, respectively. Data represent means ±s.e.m. (n= 6 for 0.5 Hz; n= 7, for 1 Hz; n= 8, for 5 or 10 Hz).

Similar articles

Cited by

References

    1. Achilles K, Okabe A, Ikeda M, Shimizu-Okabe C, Yamada J, Fukuda A, Luhmann HJ, Kilb W. Kinetic properties of Cl− uptake mediated by Na+-dependent K+-2Cl− cotransport in immature rat neocortical neurons. J Neurosci. 2007;27:8616–8627. - PMC - PubMed
    1. Adachi J, Mizoi Y. Acetaldehyde-mediated alcohol sensitivity and elevation of plasma catecholamine in man. Jpn J Pharmacol. 1983;33:531–539. - PubMed
    1. Akinci MK, Schofield PR. Widespread expression of GABAA receptor subunits in peripheral tissues. Neurosci Res. 1999;35:145–153. - PubMed
    1. Annaert WG, Llona I, Backer AC, Jacob WA, De Potter WP. Catecholamines are present in a synaptic-like microvesicle-enriched fraction from bovine adrenal medulla. J Neurochem. 1993;60:1746–1754. - PubMed
    1. Araujo F, Ruano D, Vitorica J. Absence of association between δ and γ2 subunits in native GABAA receptors from rat brain. Eur J Pharmacol. 1998;347:347–353. - PubMed