. 2008 Nov-Dec;15(6):760-9.
doi: 10.1197/jamia.M2799. Epub 2008 Aug 28.

Understanding detection performance in public health surveillance: modeling aberrancy-detection algorithms

Affiliations

Understanding detection performance in public health surveillance: modeling aberrancy-detection algorithms

David L Buckeridge et al. J Am Med Inform Assoc. 2008 Nov-Dec.

Abstract

Objective: Statistical aberrancy-detection algorithms play a central role in automated public health systems, analyzing large volumes of clinical and administrative data in real-time with the goal of detecting disease outbreaks rapidly and accurately. Not all algorithms perform equally well in terms of sensitivity, specificity, and timeliness in detecting disease outbreaks and the evidence describing the relative performance of different methods is fragmented and mainly qualitative.

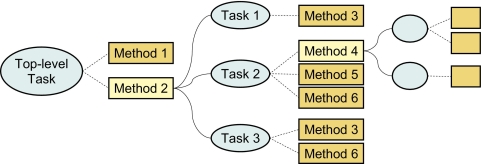
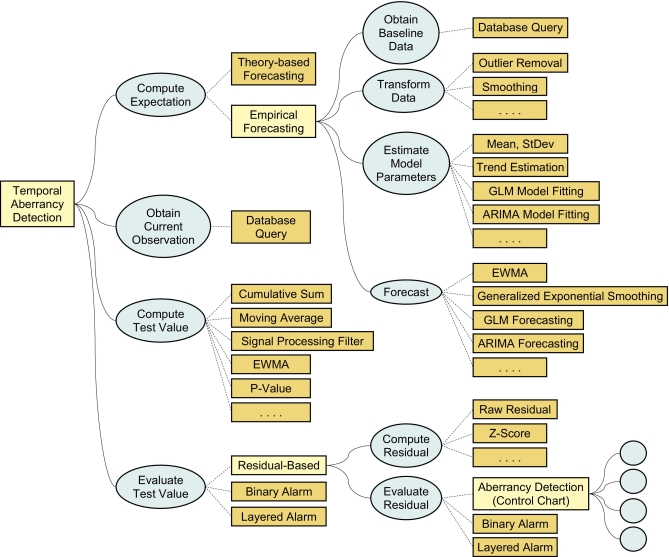
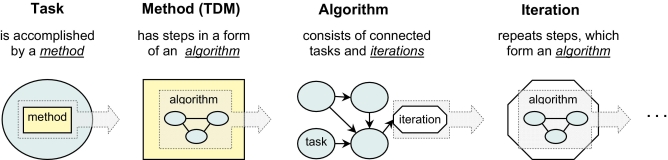
Design: We developed and evaluated a unified model of aberrancy-detection algorithms and a software infrastructure that uses this model to conduct studies to evaluate detection performance. We used a task-analytic methodology to identify the common features and meaningful distinctions among different algorithms and to provide an extensible framework for gathering evidence about the relative performance of these algorithms using a number of evaluation metrics. We implemented our model as part of a modular software infrastructure (Biological Space-Time Outbreak Reasoning Module, or BioSTORM) that allows configuration, deployment, and evaluation of aberrancy-detection algorithms in a systematic manner.

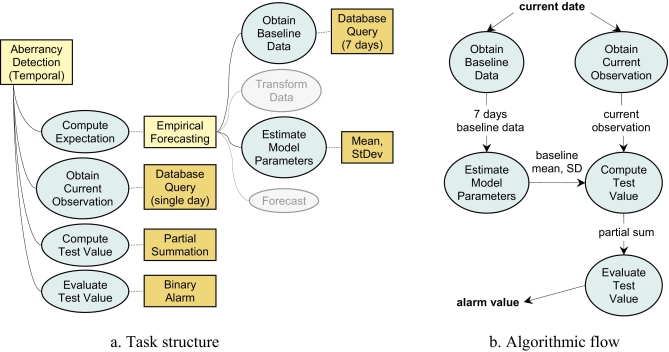
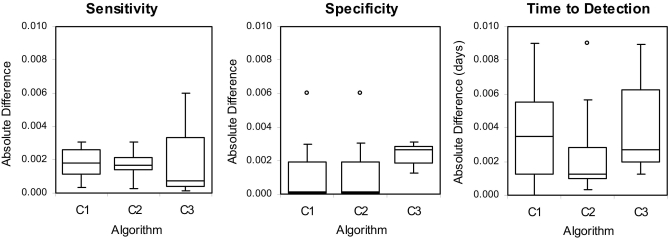
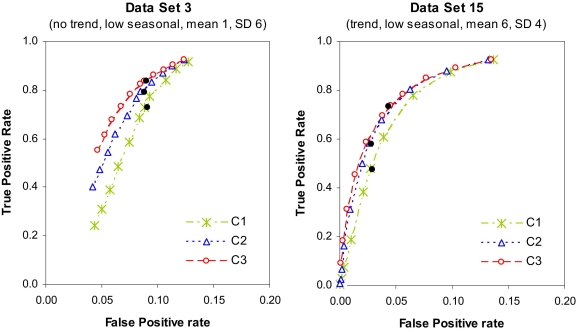
Measurement: We assessed the ability of our model to encode the commonly used EARS algorithms and the ability of the BioSTORM software to reproduce an existing evaluation study of these algorithms.

Results: Using our unified model of aberrancy-detection algorithms, we successfully encoded the EARS algorithms, deployed these algorithms using BioSTORM, and were able to reproduce and extend previously published evaluation results.

Conclusion: The validated model of aberrancy-detection algorithms and its software implementation will enable principled comparison of algorithms, synthesis of results from evaluation studies, and identification of surveillance algorithms for use in specific public health settings.


Figures

Figure 1
Figure 1
Example Task Decomposition Tree Tasks (shown as ellipses) are accomplished by application of methods (rectangles). More than one eligible method may exist for each task. Methods can be either primitive (dark rectangles) or complex (light rectangles). Complex methods (also called task-decomposition methods) break down a task into subtasks. Solid lines on the graph read as “method decomposes a task into” (AND-relationship); dashed lines connect tasks with their eligible methods (OR-relationship).
Figure 2
Figure 2
General Task Structure of Temporal Aberrancy-detection Algorithms Temporal algorithms are represented as instances of a task-decomposition method (denoted on the graph as Temporal Aberrancy Detection) that performs the task of detecting aberrations in the surveillance data by decomposing this task into four subtasks (ellipses). Each subtask can be accomplished by different methods (rectangles), some of which perform the task directly (primitive methods shown as dark rectangles), and some further decompose the task into subtasks (task-decomposition methods shown as light rectangles). For instance, the Compute Expectation task, which constitutes one of the steps (subtasks) of aberrancy detection, can in turn be decomposed into four subtasks, if Empirical Forecasting method is used. Alternatively, this task can be accomplished directly by a primitive method—Theory-based Forecasting. Similar alternatives exist for Evaluate Test Value task.
Figure 3
Figure 3
Relationship among Tasks, Methods, Iterations and Algorithms When a task is accomplished by a task-decomposition method (TDM), this implies that the method performs several steps in a particular order, i.e., the method has an algorithm associated with it. An algorithm, in turn, consists of interconnected tasks (these are the subtasks of the original, higher-level task) and iterations. An iteration specifies repetition of a sequence of tasks (or other, nested iterations); this sequence is, again, represented by an algorithm.
Figure 4
Figure 4
Representation of EARS C-family Algorithms a) The task structure of C-family algorithms is based on the general task structure of temporal aberrancy detection algorithms (see ▶). A single eligible method is selected for each task. Omitted tasks are grayed out. b) The five tasks constituting C-family algorithms are connected to each other so that the outputs from one task are used as inputs by other task(s). Note that the current date is not produced by any task and must be specified externally; in our case it is provided by a containing iteration structure (not shown here), which increments the date at each step of algorithm execution. The alarm value is not consumed by any other task—this is a final result of the detection algorithm for a single day. Individual alarm values are aggregated into a vector by the iteration structure.
Figure 5
Figure 5
Differences between CDC and BioSTORM Results for Selected Datasets The plots display the absolute differences between the sensitivity, specificity and time to detection computed in the original CDC study and those obtained in our validation study using BioSTORM. The boxes display median, upper and lower quartile differences for each of the algorithms across selected datasets. Minimal and maximal differences are shown by whiskers, and the outliers by circles.
Figure 6
Figure 6
ROC Plots for Data Sets 3 and 15 The ROC curves were obtained in an extended analysis using 11 threshold values. The points corresponding to the results reported in the original CDC study for each of the algorithms are added to the plots as bold dots.

References

    1. Lombardo JS, Buckeridge DL, Lombardo JS. Disease surveillance: A public health informatics approachHoboken, NJ: John Willey & Sons; 2007.
    1. Wagner MM, Moore AW, Aryel RM. Handbook of biosurveillanceBurlington, MA: Elsevier; 2006.
    1. Heffernan R, Mostashari F, Das D, et al. New York City Syndromic Surveillance System Sydromic Surveillance: Reports from a National Conference. New York, NY: CDC; 2003. pp. 25-27.
    1. Lombardo J, Burkom H, Elbert E, et al. A systems overview of the Electronic Surveillance System for the Early Notification of Community-Based Epidemics (ESSENCE II) J Urban Health 2003;80:i32-i42. - PMC - PubMed
    1. Loonsk JW. BioSense—a national initiative for early detection and quantification of public health emergencies. MMWR. Morbidity and Mortality Weekly Report 2004;53(Suppl):53-55. - PubMed

Publication types