

Review
doi: 10.1016/j.bbagrm.2008.07.014.
Epub 2008 Aug 6.
Visualization, documentation, analysis, and communication of large-scale gene regulatory networks
Affiliations
- PMID: 18757046
- PMCID: PMC2762351
- DOI: 10.1016/j.bbagrm.2008.07.014
Item in Clipboard
Review
Visualization, documentation, analysis, and communication of large-scale gene regulatory networks
Biochim Biophys Acta.
2009 Apr.
Abstract
Genetic regulatory networks (GRNs) are complex, large-scale, and spatially and temporally distributed. These characteristics impose challenging demands on software tools for building GRN models, and so there is a need for custom tools. In this paper, we report on our ongoing development of BioTapestry, an open source, freely available computational tool designed specifically for building GRN models. We also outline our future development plans, and give some examples of current applications of BioTapestry.
Figures

Part A: A regulatory network presented using a common graph-layout style GRN diagram. Part B: The same network rendered using BioTapestry. Also shown (inset, upper right) is a screenshot displaying a subnetwork view of the GRN at a specific time in a specific region.

BioTapestry's symbols and their use. Part A: The collection of symbols for genes and for representing off-DNA interactions and chemical species. Genes are shown in (1). The thick horizontal line is an abstract representation of the cis-regulatory region of the gene, which can be broken down into distinct labeled modules (here labeled α, β, and δ). All transcription factor inputs are shown as links terminating on the cis-regulatory region; arrowheads represent enhancers, while bars represent repressors. As the links are explicitly assigned to ordered terminals on the gene, the displayed ordering can be used as an abstract representation of the transcription factor binding sites in the regulatory region. Also, several inbound links from the same transcription factor can terminate in multiple distinct binding sites. Link inputs to the gene can be tagged to provide shorthand information; here, different colored diamonds are used to represent levels of experimental evidence. Other symbols are shown in (2) – (10). The program does not impose semantics on these symbols unless the user is building a model for simulation. However, by convention (2) represents a ligand–receptor interaction and (3) represents an indirect linkage. The plain text node (4) is often used without any inbound links to show nonspecific inputs (e.g. Ubiquitous or Unknown activator), and the box node (5) is used to show maternal factors. Note the link terminus on the center input to the box node in (5) represents a negative interaction. The diamond node (6) is often given a user-specific meaning. Bubble nodes (7) are typically used to represent protein-protein interactions and protein state changes (e.g., phosphorylation, degradation, or nuclearization). When colored black, as in (8), bubbles are typically used to represent the union of two equivalent paths (e.g. maternal and zygotically expressed protein products) onto the same targets. Most symbols can scaled to accommodate a large set of inputs, as shown for bubbles in (9) and (10). Part B: When there are added off-DNA steps between transcription and regulatory binding, beyond the canonical translation/transport that is represented by a direct link in BioTapestry, additional symbols are inserted in the link. Here, Ngn3 and E2A form a heterodimer, which then binds to NeuroD. Part C: If a gene creates multiple distinct products that are relevant to the regulatory function, the single gene output can be split into several tagged links, one for each product. Part D: Regulation by miRNAs is also modeled as post-transcriptional interaction, as illustrated.

Features of links in BioTapestry. Part A: By bundling together all the separate links from the same source, BioTapestry can efficiently represent links and cur down visual clutter. Part B: Color is an essential component of link appearance in BioTapestry. BioTapestry assigns a color to each link source, and then uses that same color for the outbound links. This approach makes it much easier to pick out the links associated with the source while inspecting the network. Even in cases when there are not enough colors to create an unambiguous rendering of the network, optionally activated “branch bubbles” (shown here) can remove crossing ambiguities. These tiny symbols can also make it much easier to visually pick out branches when quickly scanning along a link trace. Interactive features also help to track links. As shown in the enlarged inset, resting the cursor on a link reveals the link source. Part C: An example of automatically tying link presentation style to an underlying model property. In this case, link thickness is assigned to show the type of available evidence (as well as diamonds at the link terminii). Since this is automatic, the user does not have to be concerned with details of keeping the link rendering in sync with model changes, and can also rearrange the links without needing to reassign link thicknesses. This arrangement also shows how BioTapestry layout algorithms are gene-centric, with related off-DNA symbols arranged around each gene in a formal fashion based upon their role as inputs to, or outputs from, the gene. Furthermore, high-level strategies are used to group genes. Here, targets (genes with no regulatory role) are separated as a group from genes that are part of the regulatory network.
Hierarchical models in BioTapestry. Clockwise from upper left: View from the Genome (VfG), View from all Nuclei (VfA), View from the Nucleus (VfN). See text for further discussion of each model level.

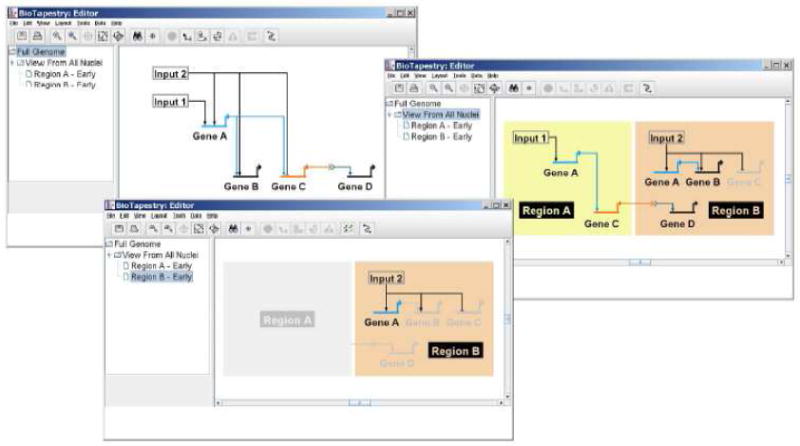
User-defined model paths and intermediate expression levels are two new features of BioTapestry. The three screenshots show how a user-defined model viewing path can improve navigation. In many cases, following the temporal progress of a given region may involve navigation to submodels that are distributed throughout the model hierarchy, as shown here. Using a toolbar control (detail, upper left), the user can select a predefined named path, and then use the forward and back buttons to smoothly move along the path. In this example, the screenshots progress counterclockwise starting from the upper center, showing selected stops along a path tracking the progress of Region A over time. The screenshots also demonstrate intermediate expression levels. In previous versions of BioTapestry, genes and links were shown as either on or off. It is now possible (in static models) to show intermediate levels of normalized (0.0 to 1.0) gene expression and link activity using a variety of user-specified visualization methods. In this example, the source gene and its links go from a normalized expression level of 0.0 to 1.0 over the three illustrated time points in the series, while the target genes go from 0.0 to 0.5. All the different methods are shown here: 1) pie glyphs next to each gene show the normalized expression level; 2) the color is interpolated between the full-on color and the inactive light grey color (both for links and genes); and 3) the thickness of the link is varied.

Images can be displayed alongside each model, including each time point of a dynamic model, as shown here. The pictures provide the physical context for the abstract network depicted in the main window.

The improved comma-separated value (CSV) file import and automatic layout capabilities of BioTapestry were used to generate a large network, with an extensive set of detailed submodels such as the one shown here, for the EGRIN (Environment and Gene Regulatory Influence Network) system for Halobacterium salinarum [4].

BioTapestry network exploration tools. Part A: BioTapestry provides a display to show alternative paths between a source and target gene. Tools such as these help the researcher to investigate possible alternative explanations of perturbation data while building the network from raw data. Part B: The recently enhanced BioTapestry search tool (dialog shown in inset) allows the user to select and zoom in on subnetworks. Here, the user has chosen to select all targets of HesC, including both the source gene and relevant link segments in the selection.

Proposed methods for introducing higher level abstractions into BioTapestry. Part A: A way to integrate process diagrams into BioTapestry, applied to the PMC domain of the sea urchin endomesoderm network. From left to right: a process diagram (see [6]) for the PMCs, an intermediate version that overlays the process diagram on the actual network components, and the actual network. Allowing the user to move smoothly between the two representations can significantly enhance his understanding of the network. Part B: The identification of functional blocks overlaid upon the concrete gene-and-link network can provide another conceptual framework for understanding the network. Shown here are putative functional building blocks in the sea urchin endomesoderm GRN; see [5]. Functional blocks are depicted by rounded bounding boxes of different color. Green: single-gene intra-cellular positive feedback latches. Orange: multi-gene intra-cellular positive feedback latches. Dark blue: inter-cellular positive feedback latch (the community effect) mediated by wnt8 signaling. Cyan: instances of negative auto-regulation. foxA expression is oscillatory [7]. The expression patterns of the other auto-repressive genes are consistent with the ‘single pulse’ functional building block. Purple: signal mediated toggle switches mediated via β-catenin and TCF/LEF in Wnt signaling, and Su(H) in Notch signaling. Red: the alx1-gcm mutual exclusion operator. Alx1 is on in the PMC domain and off in the mesoderm. Gcm is on in the mesoderm and off in the PMC. Yellow: the pmar1 gradient detection/analogue to digital switch. Pmar1 represses the repressor hesc, which in turn represses es, delta, nrl, alx1, tbr, ets1, tel, and soxc.
Similar articles
-
BioTapestry: a tool to visualize the dynamic properties of gene regulatory networks.Methods Mol Biol. 2012;786:359-94. doi: 10.1007/978-1-61779-292-2_21. Methods Mol Biol. 2012. PMID: 21938637
-
Computational representation of developmental genetic regulatory networks.Dev Biol. 2005 Jul 1;283(1):1-16. doi: 10.1016/j.ydbio.2005.04.023. Dev Biol. 2005. PMID: 15907831 Review.
-
BioTapestry now provides a web application and improved drawing and layout tools.F1000Res. 2016 Jan 8;5:39. doi: 10.12688/f1000research.7620.1. eCollection 2016. F1000Res. 2016. PMID: 27134726 Free PMC article.
-
CABeRNET: a Cytoscape app for augmented Boolean models of gene regulatory NETworks.BMC Bioinformatics. 2016 Feb 4;17:64. doi: 10.1186/s12859-016-0914-z. BMC Bioinformatics. 2016. PMID: 26846964 Free PMC article.
-
Methods for the experimental and computational analysis of gene regulatory networks in sea urchins.Methods Cell Biol. 2019;151:89-113. doi: 10.1016/bs.mcb.2018.10.003. Epub 2018 Dec 11. Methods Cell Biol. 2019. PMID: 30948033 Review.
Cited by
-
A gene regulatory network controlling the embryonic specification of endoderm.Nature. 2011 May 29;474(7353):635-9. doi: 10.1038/nature10100. Nature. 2011. PMID: 21623371 Free PMC article.
-
Global analysis of photosynthesis transcriptional regulatory networks.PLoS Genet. 2014 Dec 11;10(12):e1004837. doi: 10.1371/journal.pgen.1004837. eCollection 2014 Dec. PLoS Genet. 2014. PMID: 25503406 Free PMC article.
-
Developmental single-cell transcriptomics in the Lytechinus variegatus sea urchin embryo.Development. 2021 Oct 1;148(19):dev198614. doi: 10.1242/dev.198614. Epub 2021 Sep 27. Development. 2021. PMID: 34463740 Free PMC article.
-
Developmental gene regulatory networks in sea urchins and what we can learn from them.F1000Res. 2016 Feb 22;5:F1000 Faculty Rev-203. doi: 10.12688/f1000research.7381.1. eCollection 2016. F1000Res. 2016. PMID: 26962438 Free PMC article. Review.
-
Feedback circuits are numerous in embryonic gene regulatory networks and offer a stabilizing influence on evolution of those networks.Evodevo. 2023 Jun 16;14(1):10. doi: 10.1186/s13227-023-00214-y. Evodevo. 2023. PMID: 37322563 Free PMC article.
References
-
- Longabaugh WJR, Davidson EH, Bolouri H. Computational representation of developmental genetic regulatory networks. Dev Biol. 2005;283:1–16. - PubMed
-
- Hucka M, Finney A, Sauro HM, Bolouri H, Doyle JC, Kitano H, Arkin AP, Bornstein BJ, Bray D, Cornish-Bowden A, Cuellar AA, Dronov S, Gilles ED, Ginkel M, Gor V, Goryanin II, Hedley WJ, Hodgman TC, Hofmeyr JH, Hunter PJ, Juty NS, Kasberger JL, Kremling A, Kummer U, Le Novere N, Loew LM, Lucio D, Mendes P, Minch E, Mjolsness ED, Nakayama Y, Nelson MR, Nielsen PF, Sakurada T, Schaff JC, Shapiro BE, Shimizu TS, Spence HD, Stelling J, Takahashi K, Tomita M, Wagner J, Wang J. The Systems Biology Markup Language (SBML): A Medium for Representation and Exchange of Biochemical Network Models. Bioinformatics. 2003;19(4):524–531. - PubMed
-
- Bonneau R, Facciotti MT, Reiss DJ, Schmid AK, Pan M, Kaur A, Thorsson V, Shannon P, Johnson MH, Bare JC, Longabaugh W, Vuthoori M, Whitehead K, Madar A, Suzuki L, Mori T, Chang D, DiRuggiero J, Johnson CH, Hood L, Baliga NS. A Predictive Model for Transcriptional Control of Physiology in a Free Living Cell. Cell. 2007;131:1354–1365. - PubMed
Publication types
MeSH terms
Grants and funding
LinkOut - more resources
Full Text Sources
Other Literature Sources
Miscellaneous
