. 2009 Mar;40(3):340-8.
doi: 10.1165/rcmb.2007-0380OC. Epub 2008 Aug 28.

Molecular staging of epithelial maturation using secretory cell-specific genes as markers

Affiliations

Molecular staging of epithelial maturation using secretory cell-specific genes as markers

Anna C Zemke et al. Am J Respir Cell Mol Biol. 2009 Mar.

Abstract

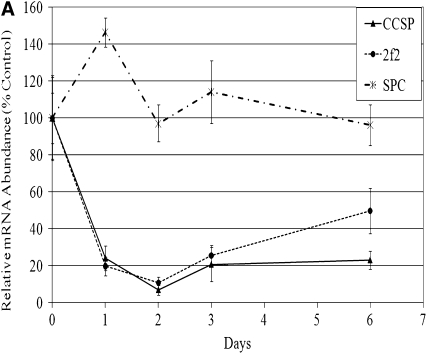
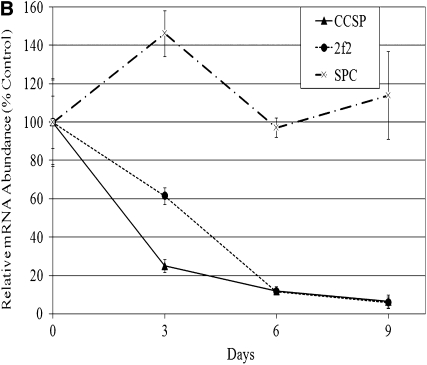
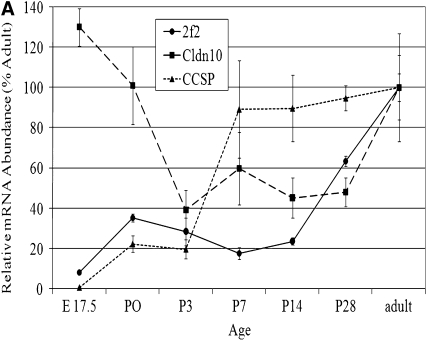
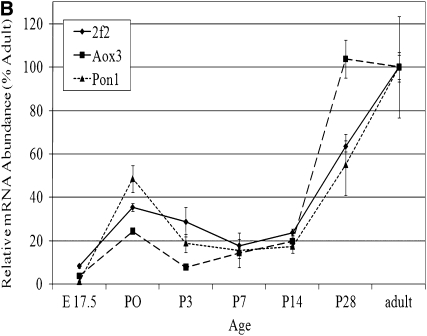
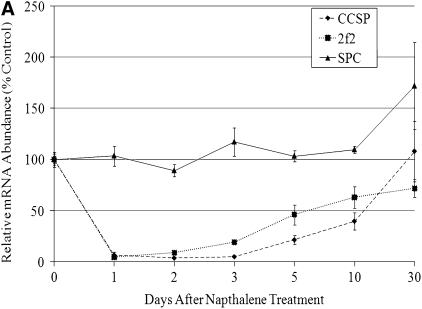
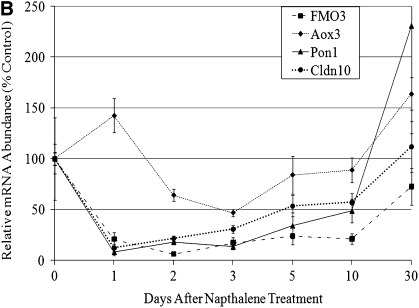
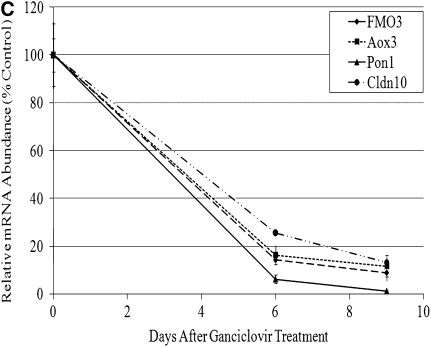
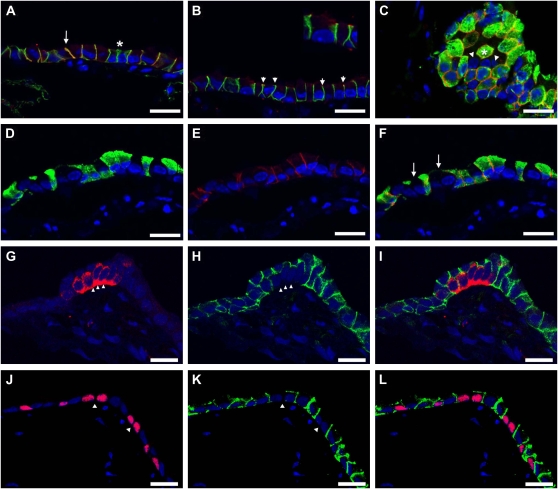
Bronchiolar Clara cells undergo phenotypic changes during development and in disease. These changes are poorly described due to a paucity of molecular markers. We used chemical and transgenic approaches to ablate Clara cells, allowing identification of their unique gene expression profile. Flavin monooxygenase 3 (Fmo3), paraoxonase 1 (Pon1), aldehyde oxidase 3 (Aox3), and claudin 10 (Cldn10) were identified as novel Clara cell markers. New and existing Clara cell marker genes were categorized into three classes based on their unique developmental expression pattern. Cldn10 was uniformly expressed in the epithelium at Embryonic Day (E)14.5 and became restricted to secretory cells at E18.5. This transition was defined by induction of CCSP. Maturation of secretory cells was associated with progressive increases in the expression of Fmo3, Pon1, Aox3, and Cyp2f2 between late embryonic and postnatal periods. Messenger RNA abundance of all categories of genes was dramatically decreased after naphthalene-induced airway injury, and displayed a sequence of temporal induction during repair that suggested sequential secretory cell maturation. We have defined a broader repertoire of Clara cell-specific genes that allows staging of epithelial maturation during development and repair.


Figures

<b>Figure 1.</b>
Figure 1.
Clara cell depletion in naphthalene and HSVtk models. (A) Wild-type or (B) CCSP-HSVtk transgenic mice were exposed to naphthalene (275 mg/kg) or ganciclovir, respectively, and expression of CCSP, Cyp2f2, and Sftpc was assayed by quantitative real-time PCR in total lung RNA (n = 4). All RT-PCR data are shown normalized to % mean mRNA abundance within unexposed control mice, with error bars indicating SEM. (A) Naphthalene exposure caused a 90% reduction in both CCSP and Cyp2f2 mRNA abundance by Day 2 (P < 0.05 for both CCSP and Cyp2f2, control versus later time points by one-way ANOVA). No statistically significant change was seen in Sftpc mRNA abundance. (B) Ganciclovir-mediated Clara cell ablation decreased CCSP and Cyp2f2 mRNA abundance to less than 10% of untreated control by Recovery Day 9 (P < 0.05 for both CCSP and Cyp2f2, control versus later time points by one-way ANOVA). No statistically significant decrease in Sftpc mRNA abundance was seen with ganciclovir exposure.
<b>Figure 2.</b>
Figure 2.
Expression of putative Clara cell markers during development. Expression of Aox3, Cyp2f2, Pon1, CCSP and Cldn10 was assayed by RT-PCR in total lung mRNA from mice of different ages. Between three and six mice were used per time point (E17.5 refers to Embryonic Day 17.5; “P” refers to Postnatal Day of tissue collection). Expression was normalized to adult expression levels and presented as % adult mouse relative mRNA abundance with SEM. (A) CCSP and Cldn10 show different developmental kinetics. CCSP increases between P3 and P7 (statistically significant by one-way ANOVA followed by Tukey analysis). Cldn10 showed a second developmental pattern, dropping between E17.5 and P3 (the only significant time points by one-way ANOVA). (B) Cyp2f2, Aox3, and Pon1 behave similarly. Significant increases in expression of all three mRNA species were observed across the time course (one-way ANOVA followed by Tukey analysis). Aox3 mRNA abundance increases more rapidly than Cyp2f2 or Pon1 (statistically significant difference at P28 by general linear model followed by Tukey analysis). The difference in kinetics between Cyp2f2 and CCSP is statistically significant at P7 and P14 (general linear model followed by Tukey analysis).
<b>Figure 3.</b>
Figure 3.
Expression of putative Clara cell markers after injury. Analysis of gene expression within the repairing lung of mice after naphthalene (250 mg/kg) or ganciclovir exposure. (A) Quantitative RT-PCR analysis of CCSP and Cyp2f2 mRNA abundance and SP-C mRNA abundance as measures of airway Clara and alveolar type 2 cells during repair after naphthalene-induced airway injury. (B) Quantitative RT-PCR analysis of Aox3, Fmo3, Pon1, and Cldn10 mRNA abundance during repair after naphthalene-induced airway injury. (C) Quantitative RT-PCR analysis of Aox3, Fmo3, Pon1, and Cldn10 mRNA abundance after ganciclovir-mediated ablation of CCSP-expressing cells in airways of CCSP-HSVtk transgenic mice. Four mice per time point were used in both experiments. Error bars show SEM.
<b>Figure 4.</b>
Figure 4.
Subcellular and cell type–specific localization of Claudin 10. Immunolocalization of Cldn10 was determined on frozen mouse lung sections with fluorescence detection and images acquired by confocal microscopy. (A) Cldn10 staining (red) and β-catenin (green). Arrow shows a cell junction with both Cldn10 and β-catenin staining along a lateral membrane. Asterisk shows a Cldn10-negative, β-catenin–positive cell junction. (B) β-catenin (green) and ZO-1 (red). The tight junction marker ZO-1 is seen as punctate staining at the apical tip of lateral membranes. β-catenin defines the adherens junction at the lateral membrane. Inset shows higher magnification regions with punctuate ZO-1 staining. (C) CCSP (green) and Cldn10 (red). Arrowheads show CCSP-negative, Cldn10-negative cells. The asterisk indicates a CCSP-positive cell surrounded by a ring of CCSP-negative cells. Cldn10 staining (red) is only seen around the center cell. (D–F) CCSP-immunoreactive cells (green in D) show lateral membrane staining for Cldn10 (red in E). A small pool of cytoplasmic staining is also seen. (F) Merged image of D and E demonstrating that cell borders between CCSP-negative cells (arrows) lack Cldn10 staining. Nuclear counter stain (DAPI) is seen in blue. (G–I) CGRP-immunoreactive cells (red in G) lack lateral membrane staining for Cldn10 (green in H). Arrowheads identify junctions between CGRP-immunoreactive cells that are negative for Cldn10. (I) Merged image of G and H. Nuclear counterstain (DAPI) is seen in blue. (J–L) FoxJ1-immunoreactive cells (red nuclei in J) lack lateral membrane staining for Cldn10 (green in K). Arrowheads identify junctions between FoxJ1-immunoreactive cells that are negative for Cldn10. (L) Merged image of J and K. Nuclear counterstain (DAPI) is seen in blue. All scale bars = 25 μm.
<b>Figure 5.</b>
Figure 5.
Claudin 10 is expressed early in mouse lung development. Mouse lungs from E14.55 or E18.5 embryos, or from P5 mice, were immunostained for localization of CCSP, Cldn10, and CGRP and images acquired by fluorescence microscopy. Nuclei were visualized using a DAPI nuclear counterstain (blue). (A) Cldn10 (red) is expressed throughout the developing airway tubules at E14.5. Scale bar = 25 μm. (B) Intense Cldn10 staining (red) is seen along lateral membranes of airway epithelial cells. Faint CCSP immunostaining (green) is seen within the airway at this developmental stage. Scale bar = 120 μm. (C) Tissue from E18.5 dpc embryos was stained as above. A row of four CCSP-negative, Cldn10-negative cells is seen surrounded by epithelial cell with strong Cldn10 lateral membrane staining and weak CCSP staining. Scale bar = 25 μm. (D) Lung tissue from a 5-day-old mouse was immunostained as above. CCSP expression has greatly increased, and Cldn10 staining remains restricted to CCSP immunoreactive cells. Scale bar = 25 μm.
<b>Figure 6.</b>
Figure 6.
Expression of Cldn10 during repair of naphthalene-injured airways. Frozen lung tissue sections were prepared from either control mice (A–C) or naphthalene-exposed mice that were recovered for either 2 days (D–F), 5 days (G–I), 10 days (J–L), or 30 days (M–O). Sections were immunostained for colocalization of either CCSP and CGRP (green and red, respectively, in panels on left), Cldn10 and CCSP (green and red, respectively, in center panels), and Cldn10 and CGRP (green and red, respectively, panels on right), and images acquired by conventional fluorescence microscopy. Scale bars = 50 μm.

Similar articles

Cited by

References

    1. Pack RJ, Al-Ugaily LH, Morris G. The cells of the tracheobronchial epithelium of the mouse: a quantitative light and electron microscope study. J Anat 1981;132:71–84. - PMC - PubMed
    1. Ten Have-Opbroek AA. Lung development in the mouse embryo. Exp Lung Res 1991;17:111–130. - PubMed
    1. Boers JE, Ambergen AW, Thunnissen FBJM. Number and proliferation of clara cells in normal human airway epithelium. Am J Respir Crit Care Med 1999;159:1585–1591. - PubMed
    1. Singh G, Katyal SL. Clara Cell Proteins. Ann N Y Acad Sci 2000;923:43–58. - PubMed
    1. Rawlins EL, Ostrowski LE, Randell SH, Hogan BL. Lung development and repair: contribution of the ciliated lineage. Proc Natl Acad Sci USA 2007;104:410–417. - PMC - PubMed

Publication types

MeSH terms