. 2008 Sep 1;68(17):6889-95.
doi: 10.1158/0008-5472.CAN-08-0161.

Efficient cross-presentation depends on autophagy in tumor cells

Affiliations

Efficient cross-presentation depends on autophagy in tumor cells

Yuhuan Li et al. Cancer Res. .

Abstract

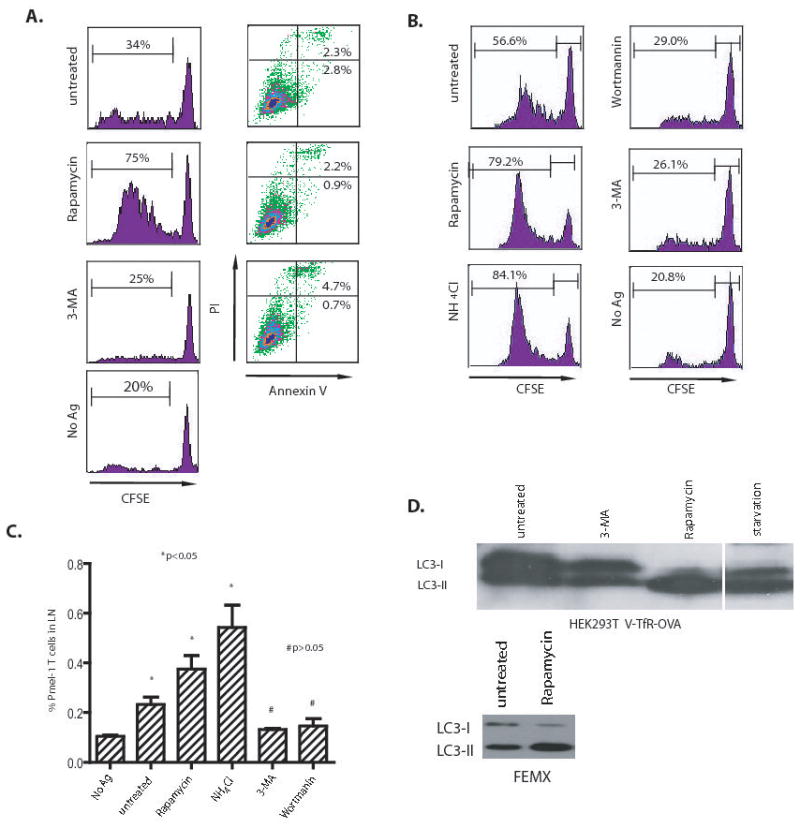
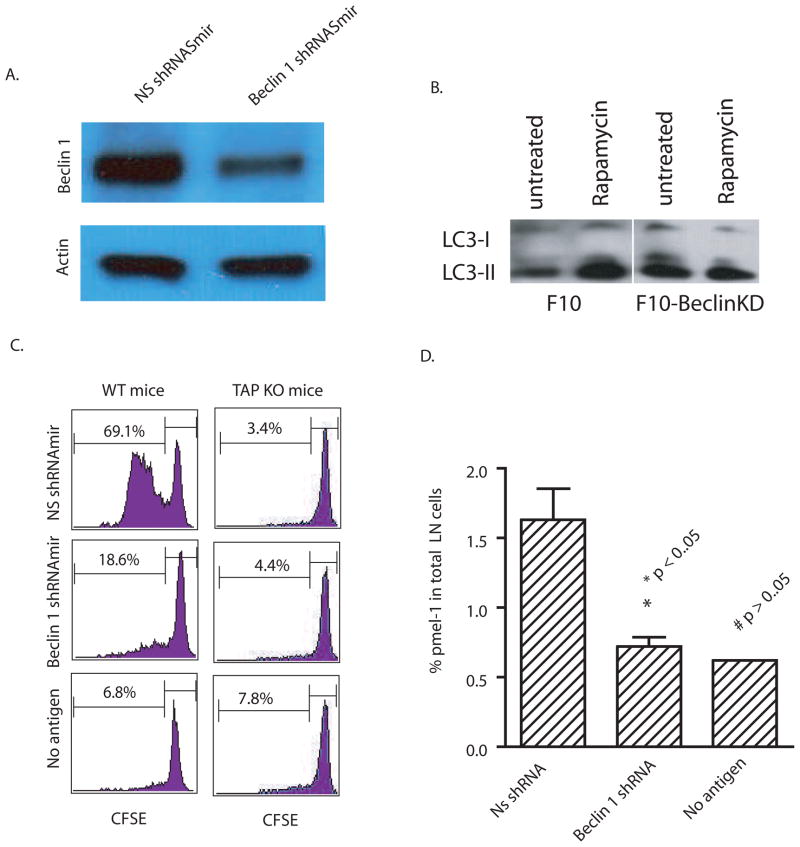
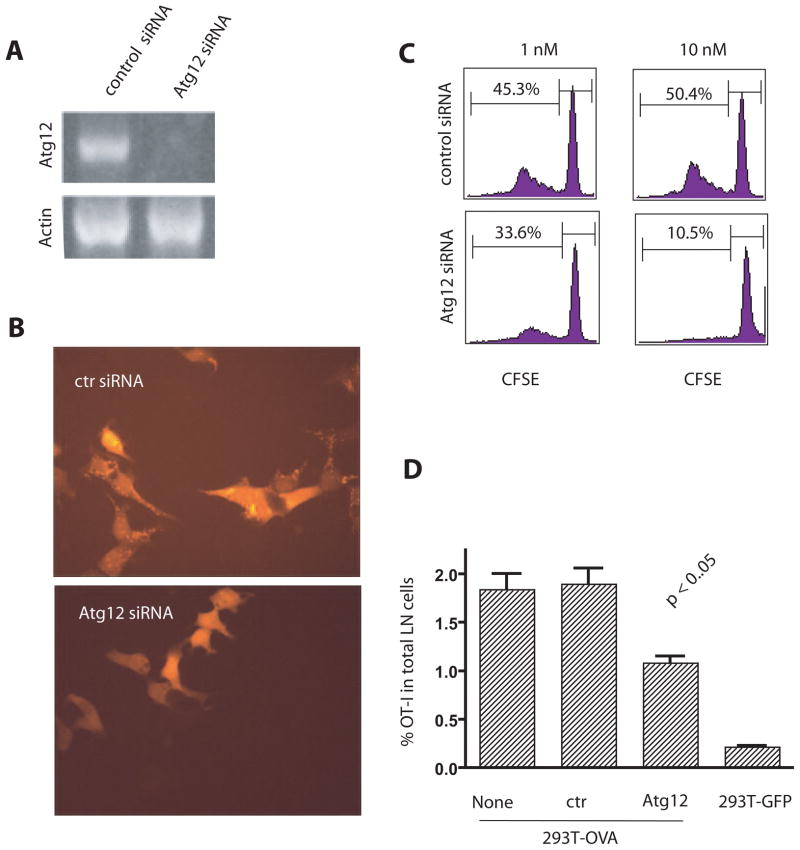
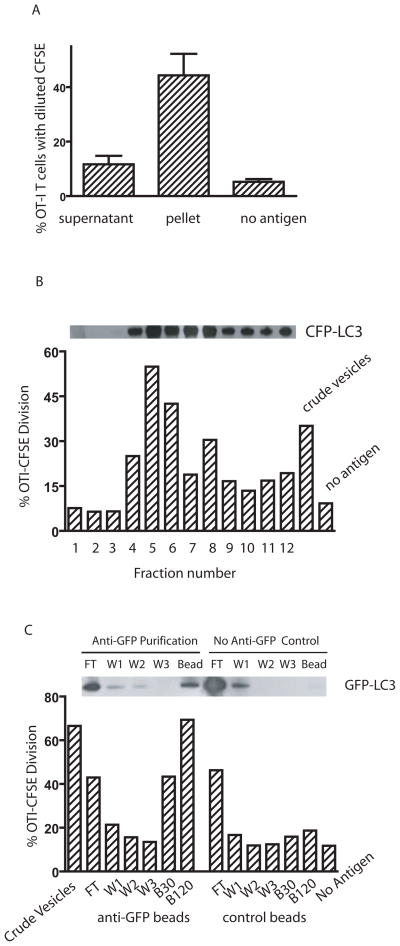
Cross-presentation of antigens is critical for the induction of adaptive immunity against tumor cells and infectious pathogens. Currently, it is not known how cross-presentation of tumor antigens is regulated by autophagy. Using both HEK 293T cells that expressed the model antigen OVA and melanoma cells as antigen donors, we show that macroautophagy in tumor cells is essential for cross-presentation by dendritic cells both in vitro and in vivo. Inhibition of autophagy abolished cross-presentation almost completely, whereas induction of autophagy dramatically enhanced the cross-presentation of tumor antigens. Moreover, purified autophagosomes were found to be efficient antigen carriers for cross-presentation. Our findings not only identified a novel role for autophagy as an active process in antigen sequestration and delivery to dendritic cells for cross-presentation, but also suggested, for the first time, that isolated autophagosomes may have potential as potent vaccines for immunotherapy against cancer and infectious diseases.


Figures

Figure 1
Figure 1. Cross-presentation of OVA and gp100 to transgenic T cells was greatly affected by the inhibition or induction of autophagy in the antigen donor cells
(A) Modulation of cross-presentation of the OVA model antigen in vitro. HEK 293T cells expressing the GFP-OVA fusion protein were treated with the autophagy-inhibitors, 3-MA or wortmanin, or the autophagy-inducer, rapamycin for 18 hours, or subjected to starvation by culturing donor cells in HBSS for 18 hours. PI and FITC-labelled annexin V were used to stain treated cells to measure the levels of apoptosis or necrosis, respectively. To assess cross-presentation, treated tumor cells were irradiated and incubated with DC for 6 hours. CFSE-labeled naive T cells from OT-I TCR transgenic mice were added to the mixture of DC and 293T donor cells and cultured for 4 to 5 days. The dilution of CFSE label in OT-I T cells was determined by flow cytometry. The results are expressed as the percentage of OT-I T cells that had undergone at least one division 4 days after coculture with DC and donor cells. The data represent typical results of three to five independent experiments. (B) and (C) Modulation of cross-presentation of the melanoma gp100 antigen in vivo. Cells from the human melanoma cell line FEMX were treated with the indicated agents as described above and then injected into the flanks of naïve C57BL/6 mice. CFSE-labelled naïve spleen cells from pmel-1 transgenic mice were adoptively transferred into tumor-bearing mice and lymph nodes draining the tumors were collected at day 6. Both the CFSE profile of pmel-1 CD8 T cells (B) and the percentage of pmel-1 T cells among the lymph node lymphocytes (C) were determined by flow cytometry. Mice that received no tumor or untreated FEMX cells were included as the controls. Each group consisted of 4 mice and the experiment was repeated once with similar results. The difference between treated and untreated groups was significant (*p <0.05); however, the difference between no Ag and 3-MA or wortmannin-treated group was not significant (#p >0.05). (D) HEK 293T cells expressing OVA antigen or FEMX melanoma cells were treated with 20 nM rapamycin or 10 mM 3-MA for 18 hours. Lysates were prepared from both untreated and treated cells. Lysate from starved HEK 293T cells was included as positive control. Ten microgram of total proteins were loaded and subjected to SDS PAGE and western blot analysis with rabbit anti-LC3 antibody.
Figure 2
Figure 2. Knock-down of Beclin 1 in antigen donor cells decreased cross-presentation of tumor antigens by DC
(A) B16 F10 melanoma cells were transduced with lentiviral vectors encoding a mir-30 modified short hairpin RNA (shRNAmir) specific for mouse Beclin 1 or a nonspecific control shRNAmir. The specific knockdown of Beclin 1 was confirmed by western blot analysis with anti-beclin 1 antibody. Anti- actin antibody was included as the control. (B) F10 melanoma cells expressing either control or Beclin-1 shRNAmirs were treated with 20 nM rapamycin for 18 hours. Lysates were prepared from both untreated and treated cells. Ten microgram of total proteins were loaded and subjected to SDS PAGE and western blot analysis with rabbit anti-LC3 antibody. (C) B16 F10 melanoma cells that were transduced with beclin 1 or control shRNAmir were injected into both flanks of C57BL/6 WT or TAP1 knock-out mice (n=4) that received 5 x10⁶ Thy1.1+ pmel-1 transgenic T cells. Six days after tumor injection, the CFSE profile of transferred pmel-1 T cells from the draining lymph nodes was determined. (D) The percentage of pmel-1 T cells found among the lymphocytes in the draining LNs of each mouse was determined by flow cytometry. All values indicate the mean with standard deviation (n=4). The difference between control and Beclin-1 knockdown was significant; however, the difference between beclin-1knockdown and no antigen was not significant. The data represent the results from three independent experiments.
Figure 3
Figure 3. Cross-presentation was reduced when autophagy was inhibited by knock down of Atg12
(A) RT-PCR for Atg12 mRNA in HEK 293 T cells expressing the GFP-OVA fusion protein after transient transfection with Atg12 or control siRNA. Actin mRNA was included as the control. (B) Diminished formation of tdTomato-LC3 punctates after ATG12 knockdown. HEK 293T cells stably expressing tdTomato-LC3 fusion protein following infection with a viral vector were transfected with Atg12 siRNA or control siRNA. Fourty-eight hours later, transfected cells were treated with rapamycin and NH4Cl for 6 hours to induce the formation of punctates. (C) Reduced cross-presentation of OVA from donor cells after transfection with Atg12 siRNA in vitro. HEK 293T cells that expressed GFP-OVA fusion protein were transfected with Atg 12 or luciferase siRNA 24 hours before they were loaded onto DC. CFSE-labeled OT-I naive T cells were added after 6 hrs of DC and 293T coculture and the dilution of CFSE-label in OT-I T cells at day 4 was determined by flow cytometry. The results are typical of five independent experiments. The numbers indicate the percentage of OT-I T cells that had undergone at least one cell division. (D) Reduced cross-presentation of OVA from donor cells after transfection with Atg12 siRNA in vivo. HEK 293T cells expressing GFP-OVA fusion protein were transfected with either control siRNA or Atg12 siRNA. Two days later, control or Atg12 siRNA treated cells were injected into both flanks of mice that also received 5 × 10⁶ Thy1.1+ OT-I transgenic T cells. HEK 293T cells expressing GFP protein were used as the negative control. The percentage of OT-I T cells found in the draining LNs of each mouse was determined individually by flow cytometry five days after injection. All values were shown as the mean with s.d. (n=4). The typical results from three independent experiments are shown.
Fig. 4
Fig. 4. Autophagosomes are the source of antigen for cross-presentation
(A) Cross-presentation activity was found primarily in the large vesicles obtained from centrifugation of cell lysates. HEK 293T cells expressing OVA and CFP-LC3 were treated with bortezomib and NH4Cl for 24 hrs and then lysed by mild sonication. The lysate was fractionated into supernatant and a pellet containing large vesicles by high-speed centrifugation (10,000g for 15 min). The pellet was resuspended in the original volume. DCs were incubated with an equal volume of supernatant or resuspended pellet and used to stimulate CFSE-labelled OT-I T cells in vitro. The dilution of CFSE-label in OT-I T cells at day 4 was determined by flow cytometry. Data represent the mean and standard deviation from four independent experiments. (B) The highest cross-presentation activity and the greatest amount of LC3 was found in the lighter density fraction of large vesicles. The pellet was resuspended in 27% Percoll solution and subjected to ultra-speed centrifugation (36,000g for 30 min). One ml fractions were collected from the top to the bottom of the gradient. The distribution of CFP-LC3 in the gradients was analyzed by western blot with anti-GFP antibody (above the bar graph). DCs were loaded with each fraction and used to stimulate CFSE-labelled OT-I T cells in vitro. The dilution of CFSE-label in OT-I T cells at day 4 was determined by flow cytometry (shown in the bar graph). Data represent a typical result from three independent experiments. (C) Purified autophagosomes delivered OVA very efficiently for cross-presentation. HEK 293T cells were transiently transfected with plasmids encoding GFP-LC3 and OVA. Forty-eight hours after transfection, cells were treated and lysed as above, and the large vesicles were prepared from lysates. The resuspended pellet was purified using a mouse anti-GFP antibody and magnetic beads conjugated with anti-mouse IgG. The control was performed in the absence of the mouse anti-GFP antibody. Different fractions, including the crude vesicles before purification, flow through (FT), three washing steps (W1, W2, W3), and the bead fractions (B30 and B120) were obtained and kept in their original volume. Thirty ls of each fraction were loaded onto DC, which were used to stimulate OT-1 T cells as above (FT, W1, W2, W3, B30). An additional tube with 120 ls of bead fraction was included (B120). The figure above the bar graph shows the western blot analysis of each fraction with anti-GFP antibody. Data represent a typical result from two independent experiments.

References

    1. Heath WR, Carbone FR. Cross-presentation, dendritic cells, tolerance and immunity. Annu Rev Immunol. 2001;19:47–64. - PubMed
    1. Serna A, Ramirez MC, Soukhanova A, Sigal LJ. Cutting edge: efficient MHC class I cross-presentation during early vaccinia infection requires the transfer of proteasomal intermediates between antigen donor and presenting cells. J Immunol. 2003;171:5668–5672. - PubMed
    1. Norbury CC, Basta S, Donohue KB, et al. CD8+ T cell cross-priming via transfer of proteasome substrates. Science. 2004;304:1318–1321. - PubMed
    1. Klionsky DJ, Emr SD. Autophagy as a regulated pathway of cellular degradation. Science. 2000;290:1717–1721. - PMC - PubMed
    1. Komatsu M, Waguri S, Chiba T, et al. Loss of autophagy in the central nervous system causes neurodegeneration in mice. Nature. 2006;441:880–884. - PubMed

Publication types