

Gemcitabine and cytosine arabinoside cytotoxicity: association with lymphoblastoid cell expression
- PMID: 18757419
- PMCID: PMC2562356
- DOI: 10.1158/0008-5472.CAN-08-0405
Gemcitabine and cytosine arabinoside cytotoxicity: association with lymphoblastoid cell expression
Abstract
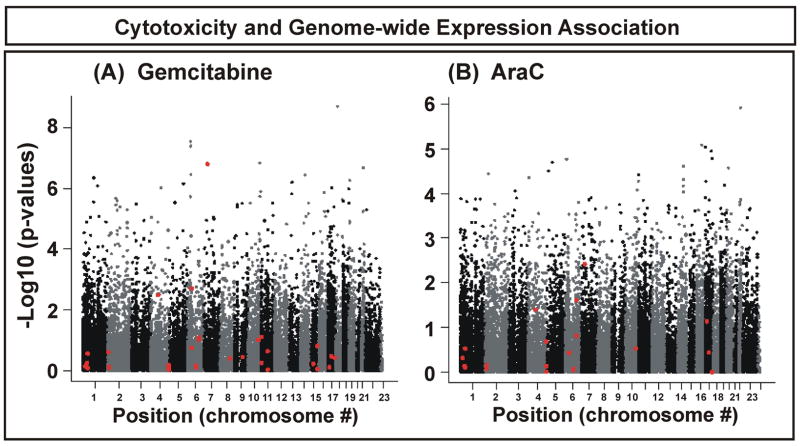
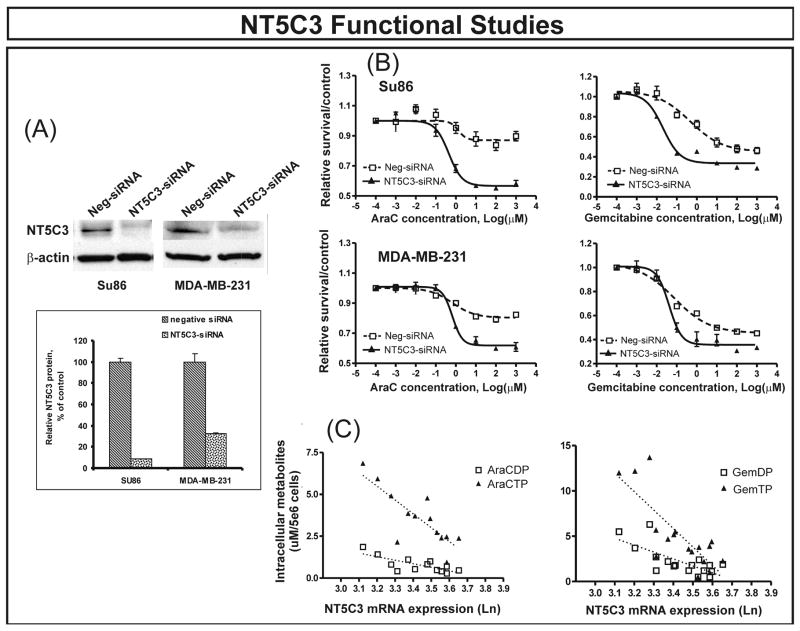
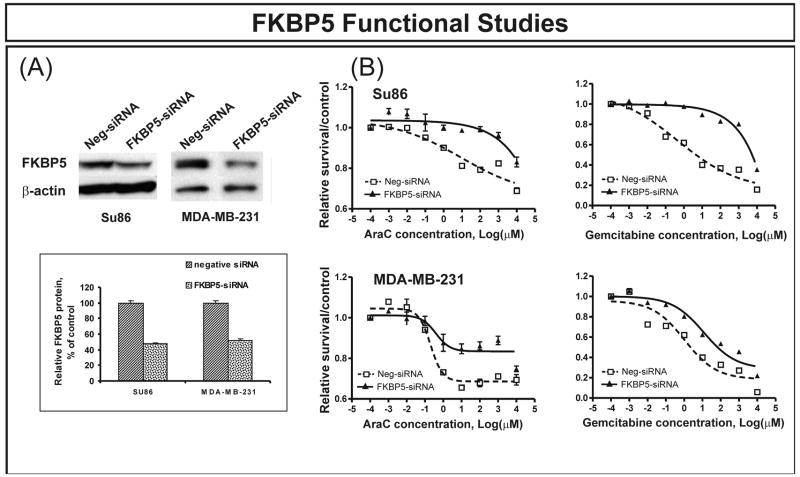
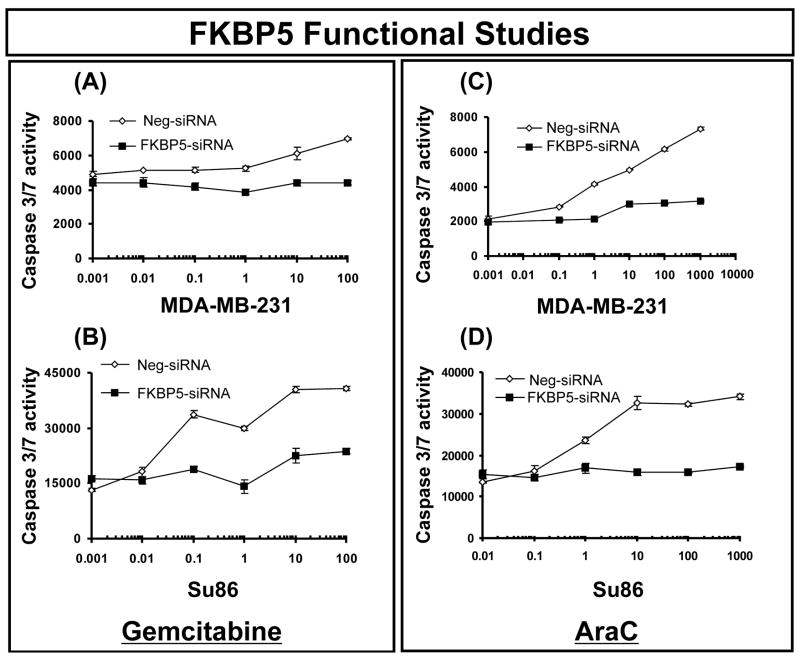
Two cytidine analogues, gemcitabine (dFdC) and 1-beta-d-arabinofuranosylcytosine (AraC), show significant therapeutic effect in a variety of cancers. However, response to these drugs varies widely. Evidence from tumor biopsy samples shows that expression levels for genes involved in the cytidine transport, metabolism, and bioactivation pathway contribute to this variation in response. In the present study, we set out to test the hypothesis that variation in gene expression both within and outside of this "pathway" might influence sensitivity to gemcitabine and AraC. Specifically, Affymetrix U133 Plus 2.0 GeneChip and cytotoxicity assays were performed to obtain basal mRNA expression and IC(50) values for both drugs in 197 ethnically defined Human Variation Panel lymphoblastoid cell lines. Genes with a high degree of association with IC(50) values were involved mainly in cell death, cancer, cell cycle, and nucleic acid metabolism pathways. We validated selected significant genes by performing real-time quantitative reverse transcription-PCR and selected two representative candidates, NT5C3 (within the pathway) and FKBP5 (outside of the pathway), for functional validation. Those studies showed that down-regulation of NT5C3 and FKBP5 altered tumor cell sensitivity to both drugs. Our results suggest that cell-based model system studies, when combined with complementary functional characterization, may help to identify biomarkers for response to chemotherapy with these cytidine analogues.
Figures
References
-
- Smid K, Bergman AM, Eijk PP, et al. Micro-array analysis of resistance for gemcitabine results in increased expression of ribonucleotide reductase subunits. Nucleosides Nucleotides Nucleic Acids. 2006;25:1001–7. - PubMed
-
- Gullans SR. Connecting the dots using gene-expression profiles. N Engl J Med. 2006;355:2042–4. - PubMed
-
- Thuerigen O, Schneeweiss A, Toedt G, et al. Gene expression signature predicting pathologic complete response with gemcitabine, epirubicin, and docetaxel in primary breast cancer. J Clin Oncol. 2006;24:1839–45. - PubMed
-
- Weinshilboum RM, Wang L. Pharmacogenetics and pharmacogenomics: development, science, and translation. Annu Rev Genomics Hum Genet. 2006;7:223–45. - PubMed
-
- Berlin JD, Catalano P, Thomas JP, Kugler JW, Haller DG, Benson AB., 3rd Phase III study of gemcitabine in combination with fluorouracil versus gemcitabine alone in patients with advanced pancreatic carcinoma: Eastern Cooperative Oncology Group Trial E2297. J Clin Oncol. 2002;20:3270–5. - PubMed
Publication types
MeSH terms
Substances
Grants and funding
LinkOut - more resources
Full Text Sources
Other Literature Sources
Molecular Biology Databases
Research Materials
Miscellaneous
