. 2008 Sep 1;68(17):7090-9.
doi: 10.1158/0008-5472.CAN-08-0643.

Thrombospondin 1 promotes tumor macrophage recruitment and enhances tumor cell cytotoxicity of differentiated U937 cells

Affiliations

Thrombospondin 1 promotes tumor macrophage recruitment and enhances tumor cell cytotoxicity of differentiated U937 cells

Gema Martin-Manso et al. Cancer Res. .

Abstract

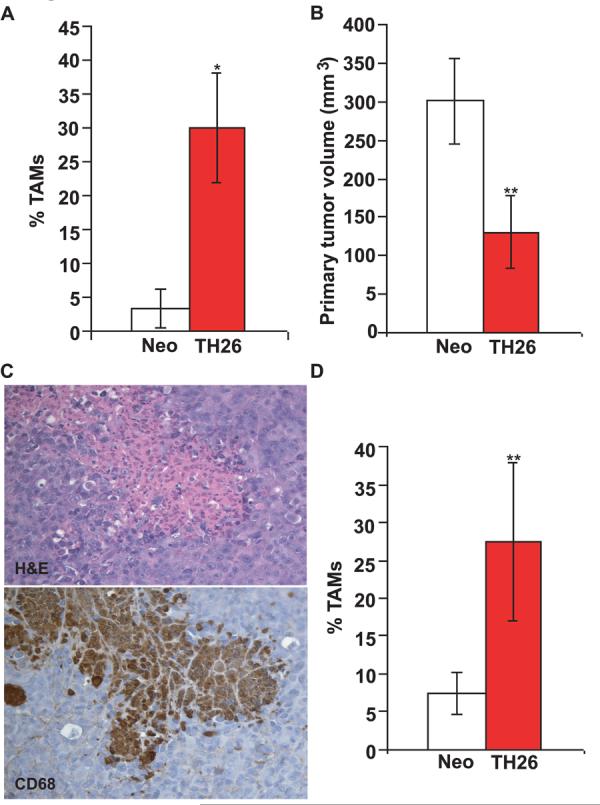
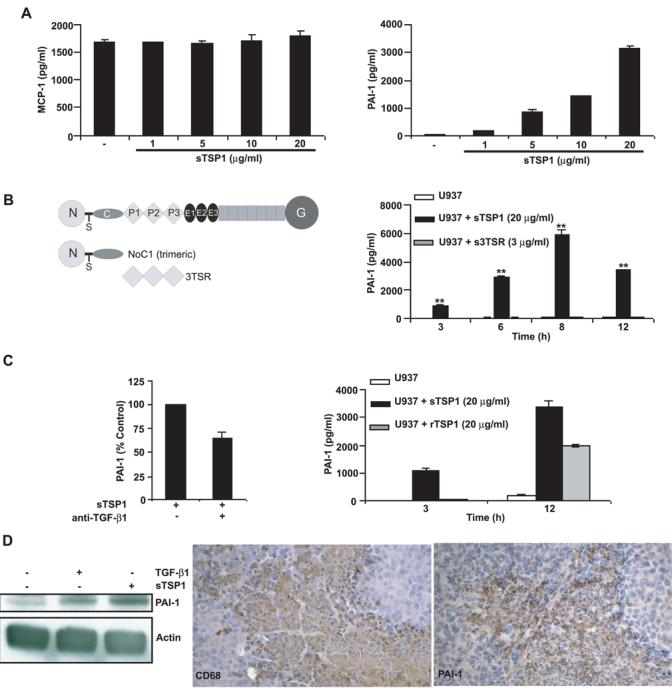
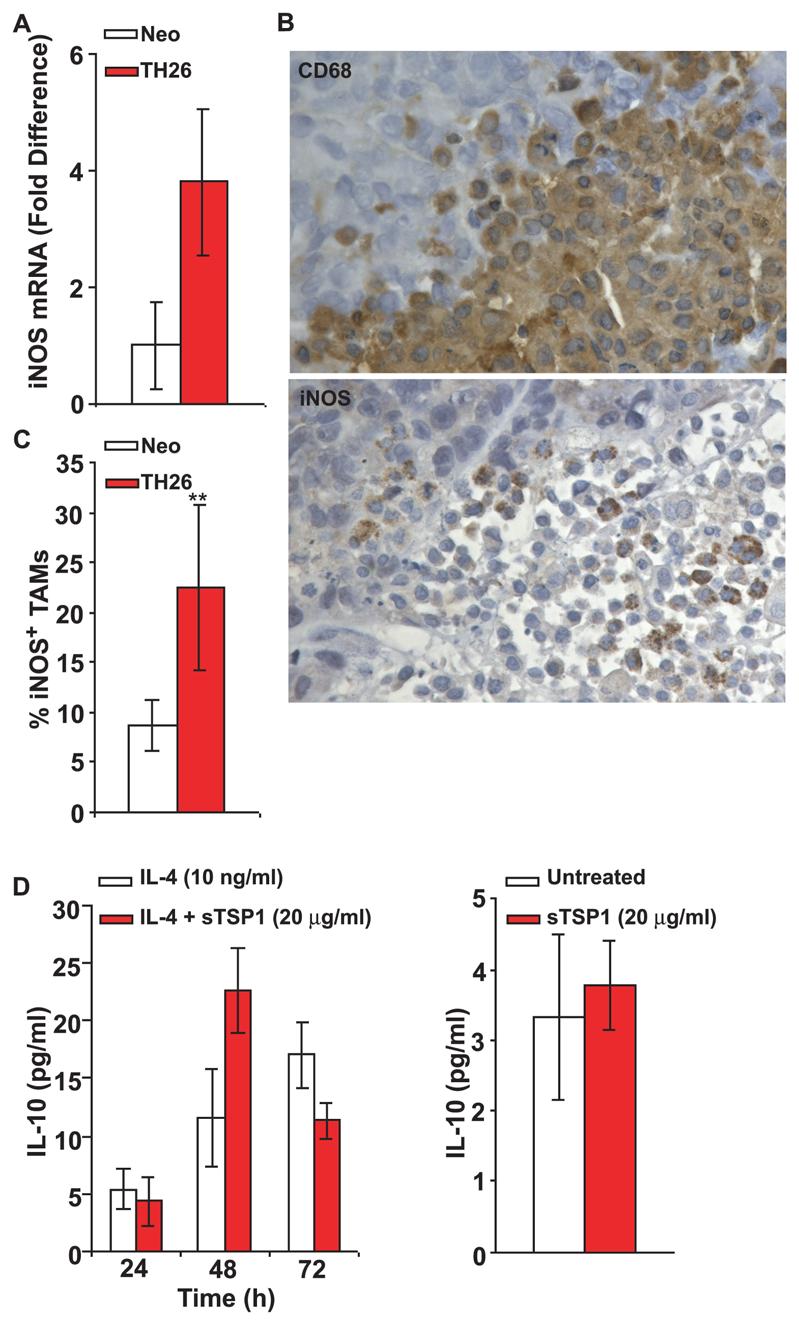
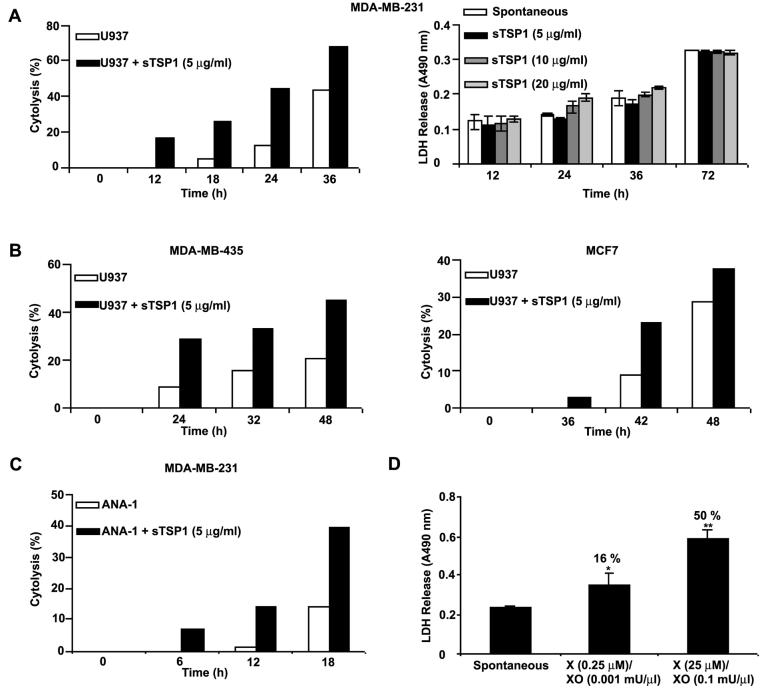
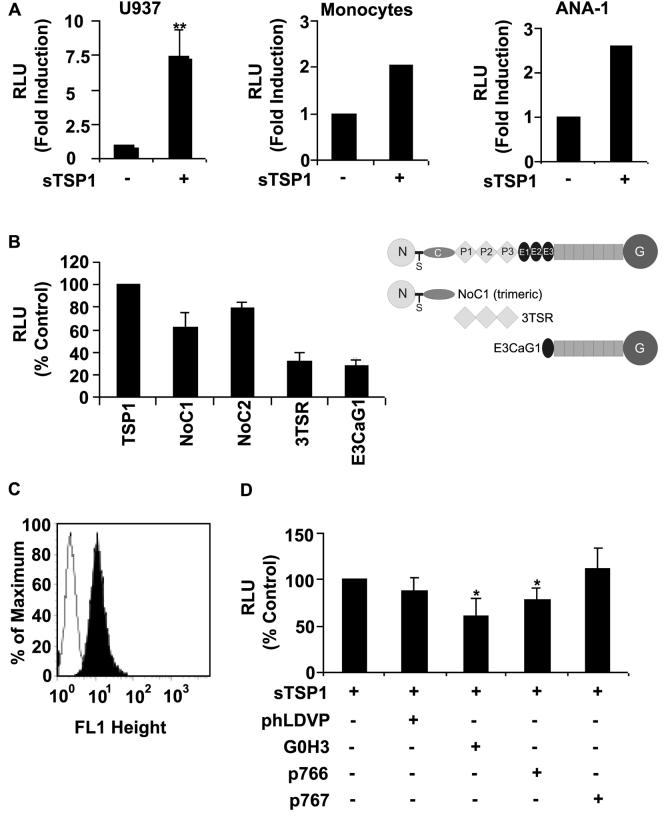
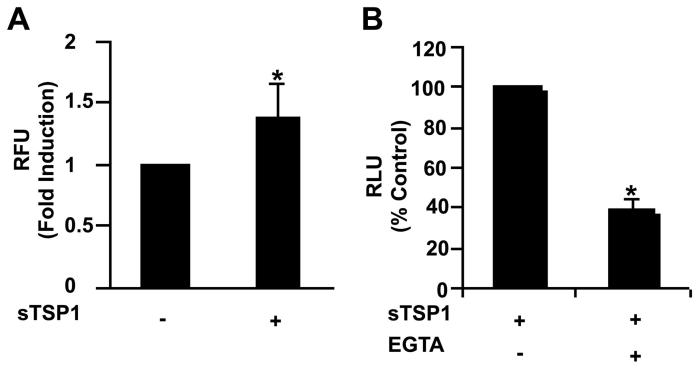
Inhibition of tumor growth by thrombospondin (TSP) 1 is generally attributed to its antiangiogenic activity, but effects on tumor immunity should also be considered. We show that overexpression of TSP1 in melanoma cells increases macrophage recruitment into xenograft tumors grown in nude or beige/nude mice. In vitro, TSP1 acutely induces expression of plasminogen activator inhibitor-1 (PAI-1) by monocytic cells, suggesting that TSP1-induced macrophage recruitment is at least partially mediated by PAI-1. Tumor-associated macrophages (TAM) can either promote or limit tumor progression. The percentage of M1-polarized macrophages expressing inducible nitric oxide synthase is increased in TSP1-expressing tumors. Furthermore, soluble TSP1 stimulates killing of breast carcinoma and melanoma cells by IFN-gamma-differentiated U937 cells in vitro via release of reactive oxygen species. TSP1 causes a significant increase in phorbol ester-mediated superoxide generation from differentiated monocytes by interaction with alpha(6)beta(1) integrin through its NH(2)-terminal region. The NH(2)-terminal domain of TSP2 also stimulates monocyte superoxide production. Extracellular calcium is required for the TSP1-induced macrophage respiratory burst. Thus, TSP1 may play an important role in antitumor immunity by enhancing recruitment and activation of M1 TAMs, which provides an additional selective pressure for loss of TSP1 and TSP2 expression during tumor progression.


Figures

Figure 1
Figure 1
THBS1 over-expression promotes macrophage recruitment in tumor-bearing nude mice. A, Tissue sections cut from paraffin-embedded tumors harvested from NIH-bg/nu mice injected in the mammary fat pads with TH26 or Neo MDA-MB-435 clones were stained with Hematoxylin-Eosin and rat anti-mouse CD68 antibody (clone FA-11). Quantitative analysis of macrophage infiltration into the tumor specimens was performed by evaluating the number of CD68-positive cells per 100x field in non-necrotic areas. The results are presented as a percentage of TAMs in Neo control (white columns) versus THBS1-transfected TH26 tumors (red columns). B, primary tumor size 24 days post-injection in NIH-nu/nu mice given subcutaneous injections of TH26 (red columns) or Neo cells (white columns). Histogram represents the tumor volume (mm3) of all animals within each group that developed a tumor. C, Paraffin-embedded sections cut from clone TH26 tumors grown subcutaneously in NIH-nu/nu mice were stained with Hematoxylin-Eosin (top) and rat anti-mouse CD68 antibody (clone FA-11) (bottom). Representative photomicrographs of adjacent slides are shown from experiments conducted in tumor samples from 12 NIH-nu/nu mice. Three mice did not develop tumors. Identical patterns were observed in all of the tumors examined. Magnification, x200. D, quantitative analysis of macrophage infiltration into subcutaneous tumors grown in NIH-nu/nu mice was evaluated as the percent of CD68-positive cells in multiple 100x fields in non-necrotic areas. The results are presented as a percentage of TAMs in Neo (white column) and TH26 tumors (red column).
Figure 2
Figure 2
Effects of TSP1 on MCP-1 and PAI-1 expression in differentiated U937 human monocytic cells and mouse macrophages. A-C, differentiated U937 cells (1 × 10⁶/0.5 ml RPMI 1640 with 0.5% FBS) were incubated in the absence or the presence of soluble TSP1, soluble recombinant type 1 repeats of TSP1 (3TSR, B), or soluble recombinant human TSP1 (C right). After 12 h incubation (A), or at the indicated times (B-C right), the supernatants were harvested, and total MCP-1 and PAI-1 were determined using a multiplexed ELISA array (Quansys Biosciences), as described in Materials and Methods. Data are representative of at least four different experiments. C left, differentiated U937 cells were incubated with neutralizing TGFβ1 antibody (clone 9016) for 15 min before the addition of soluble TSP1 (20μg/ml). Culture supernatants collected after 12 h were used to measure total PAI-1. Data are representative of two different experiments. D left, serum-deprived murine RAW264.7 cells were stimulated with TGFβ1 (1 ng/ml), as a positive control, or soluble TSP1 (20 μg/ml) for 2 h. The experiment was repeated three times, and a representative anti-PAI-1 blot is shown. Actin was used to confirm equal protein loading. D right, Paraffin-embedded sections cut from TH26 tumors grown subcutaneously in NIH-nu/nu mice were stained with rat anti-mouse CD68 antibody (clone FA-11) (left) and rabbit anti-mouse PAI-1 antibody (right). Representative photomicrographs of adjacent sections are shown from experiments conducted in tumor samples from 12 NIH-nu/nu mice. Identical patterns were observed in all of the tumors examined. Magnification, x200.
Figure 3
Figure 3
Increased iNOS-expressing M1 TAMs in TSP1 over-expressing tumors. A, Real-time quantitative reverse transcription-PCR analysis of mRNA expression in TH26 and Neo tumors from 6 NIH-nu/nu mice. Fold difference was adjusted to HPRT1 internal control values. Relative quantification of iNOS was calculated by the 2ΔΔCT method. B, Immunohistochemical analysis of TH26 and Neo tumors in NIH-nu/nu mice. Adjacent sections were stained using rat anti-mouse CD68 antibody (clone FA-11) (top) and rabbit polyclonal antibody to iNOS to detect M1 differentiated TAMs (bottom). The results are representative of tumor samples from 12 NIH-nu/nu mice, which showed identical patterns. Magnification, x400. C, Quantitative analysis of CD68-positive cells expressing iNOS in the tumor specimens was performed by evaluating the percentage of iNOS-positive macrophages in multiple 100x fields. The results are presented as the percentage of iNOS-positive TAMs in Neo control (white columns) and TH26 tumors (red columns). D left, U937 cells (2 × 10⁵/0.5 ml AIM-V) were incubated with IL-4 to induce M2 differentiation in the absence or the presence of soluble TSP1. At the indicated times, the supernatants were harvested, and IL-10 was determined using a Multiplexed ELISA array (Quansys Biosciences) as described in Materials and Methods. D right, U937 cells were differentiated with IL-4 for 72 h, and then the differentiated cells (1 × 10⁶/1 ml AIM-V) were incubated with soluble TSP1. After 12 h incubation, the supernatants were harvested, and IL-10 was determined using a Multiplexed ELISA array.
Figure 4
Figure 4
TSP1 increases U937 human monocytic cell-mediated tumoricidal activity. A left-B, MDA-MB-231, MDA-MB-435, and MCF-7 target cells (2 × 10⁴/150 μl RPMI 1640 with 10 % FBS) were seeded into 16-well sensor plates and incubated for up to 24 h. After this incubation, differentiated U937 effector cells (8 × 10⁵/50 μl RPMI 1640 with 10 % FBS) were directly added into wells containing target cells, in the absence or the presence of soluble TSP1. The measurements were automatically collected by the analyzer RT-CES system (ACEA Biosciences) for up to 48 h. Data are representative of three different experiments. A right, MDA-MB-231 cells (2 × 10⁴/200 μl RPMI 1640 with 10 % FBS) were seeded into 96-well plates and incubated for up to 72 h in the absence or the presence of soluble TSP1 (5-20 μg/ml). At the indicated times, medium samples were collected and LDH released was measured as described in Materials and Methods. The absorbance was recorded at 490 nm. Data are representative of two different experiments. C, MDA-MB-231 target cells (2 × 10⁴/150 μl RPMI 1640 with 10 % FBS) were seeded into 16-well sensor plates and incubated for up to 24 h. After this incubation, activated ANA-1 effector cells (8 × 10⁵/50 μl RPMI 1640 with 10 % FBS and 0.5 mM aminoguanidine) were directly added into wells containing target cells, in the absence or the presence of soluble TSP1. The measurements were automatically collected by the RT-CES system for up to 18 h. Data are representative of four different experiments. D, MDA-MB-231 target cells (2,500cells/100 μl RPMI 1640 with 1.25 % FBS) were seeded into 96-well plates and incubated for 72 h in the absence or the presence of different doses of xanthine and xanthine oxidase. The medium samples were collected, and LDH released was measured. The absorbance was recorded at 490 nm. The percentage of cytotoxicity is shown above each bar and is calculated as (Experimental-Spontaneous/Maximum-Spontaneous) x100. Maximum LDH release was determined by complete lysis of target cells.
Figure 5
Figure 5
TSP1 enhances extracellular release of O2 in human and mouse monocytic cells. A (left), differentiated U937 cells (5 × 10⁵/condition) were stimulated with PMA (100 ng/ml) in the absence or presence of soluble TSP1 (20 μg/ml ) for up to 70 min, and quantitative analysis of O2 levels was performed with a LumiMax Superoxide Anion detection kit (Stratagene) and quantified using a luminometer. The results are presented as the ratio maximum activity (relative luminescence units, RLU)/min. The data represent the mean ± SD of five different experiments. A (center), analysis of O2 release from human monocytic cells. Monocytes obtained from human PBMCs (5 × 10⁵/condition) were stimulated with PMA (10 ng/ml) in the absence or the presence of soluble TSP1 (20 μg/ml ) for 30 min. The results are presented as the ratio maximum activity (RLU)/min. Data are representative of four different experiments. A (right), activated ANA-1 cells (8 × 10⁵/condition) were stimulated with PMA (100 ng/ml) and aminoguanidine (0.5 mM) in the absence or the presence of soluble TSP1 (5 μg/ml) for 130 min. The results are presented as RLU and are representative of two different experiments. B, analysis of O2 release from differentiated U937 cells (5 × 10⁵/condition) stimulated as described above in the absence or the presence of soluble TSP1 (20 μg/ml), NoC1, 3TSR, or E3CaG1 (10 μg/ml) for up to 40 min. The results are presented as a % of control RLU determined in the presence of TSP1 and represent the mean ± SD of up to four different experiments. C, surface α6-integrin expression in differentiated U937 cells was analyzed using flow cytometry, as described in Materials and Methods. D, analysis of O2 release from differentiated U937 cells (5 × 10⁵/condition) stimulated as described above with soluble TSP1 (20 μg/ml) in the absence or the presence of the α4β1 integrin antagonist phLDVP (1 μM), the function-blocking rat anti-human α6 monoclonal antibody (clone G0H3)( 5 μg/ml), p766, or control peptide (p767, 200 μM) for up to 40 min. The results are presented as a % of control RLU determined in the presence of TSP1 alone and represent the mean ± SD of up to five different experiments.
Figure 6
Figure 6
Ca2+ is an intracellular second messenger for activation of the oxidative burst in TSP1-stimulated U937 monocytic cells. A, analysis of intracellular free Ca2+ was performed in differentiated U937 cells. U937 (4 × 10⁵ cells/condition) were loaded with Fluo-4 for 30 min and then treated with soluble TSP1 (20 μg/ml), as described in Materials and Methods. The cells were then placed in a fluorometer and measurements were acquired for 40 min. Results are presented as fold induction in TSP1 treated (+) relative to untreated cells (−). The data represent the mean ± SD of four different experiments. B, analysis of O2 release from differentiated U937 cells (5 × 10⁵/condition) stimulated with PMA (100 ng/ml) and soluble TSP1 (20 μg/ml ) in the absence or the presence of EGTA (1 mM) for up to 45 min. The levels of O2 were determined by luminescence as described in Figure 5. The results are presented as a % of control RLU determined in the presence of TSP1 alone and are representative of two different experiments.

Similar articles

Cited by

References

    1. Agah A, Kyriakides TR, Lawler J, Bornstein P. The lack of thrombospondin-1 (TSP1) dictates the course of wound healing in double-TSP1/TSP2-null mice. Am J Pathol. 2002;161:831–9. - PMC - PubMed
    1. Stenina OI, Byzova TV, Adams JC, McCarthy JJ, Topol EJ, Plow EF. Coronary artery disease and the thrombospondin single nucleotide polymorphisms. Int J Biochem Cell Biol. 2004;36:1013–30. - PubMed
    1. Crawford SE, Stellmach V, Murphy-Ullrich JE, et al. Thrombospondin-1 is a major activator of TGF-beta1 in vivo. Cell. 1998;93:1159–70. - PubMed
    1. Isenberg JS, Romeo MJ, Abu-Asab M, et al. Increasing survival of ischemic tissue by targeting CD47. Circ Res. 2007;100:712–20. - PubMed
    1. Roberts DD. Regulation of tumor growth and metastasis by thrombospondin-1. Faseb J. 1996;10:1183–91. - PubMed

Publication types

Substances