FEM1A and FEM1B: novel candidate genes for polycystic ovary syndrome
- PMID: 18757445
- PMCID: PMC2583941
- DOI: 10.1093/humrep/den324
FEM1A and FEM1B: novel candidate genes for polycystic ovary syndrome
Abstract
Background: Human homologs (FEM1A, FEM1B, FEM1C) of nematode sex determination genes are candidate genes for polycystic ovary syndrome (PCOS). We previously identified a FEM1A mutation (H500Y) in a woman with PCOS; FEM1B has been implicated in insulin secretion.
Methods: Women with and without PCOS (287 cases, 187 controls) were genotyped for H500Y and six FEM1A single nucleotide polymorphisms (SNPs), five FEM1B SNPs and five FEM1C SNPs. SNPs and haplotypes were determined and tested for association with PCOS and component phenotypes.
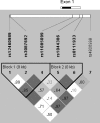
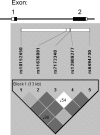
Results: No subject carried the FEM1A H500Y mutation. FEM1A SNPs rs8111933 (P = 0.001) and rs12460989 (P = 0.046) were associated with an increased likelihood of PCOS whereas FEM1A SNP rs1044386 was associated with a reduced probability of PCOS (P = 0.013). FEM1B SNP rs10152450 and a linked SNP were associated with a reduced likelihood of PCOS (P = 0.005), and lower homeostasis model assessment (HOMA) for beta-cell function (HOMA-%B, P = 0.011) and lower HOMA for insulin resistance (HOMA-IR, P = 0.018). FEM1B SNP rs12909277 was associated with lower HOMA-%B (P = 0.008) and lower HOMA-IR (P = 0.037). Haplotype associations were consistent with SNP results, and also revealed association of FEM1B haplotype TGAGG with increased HOMA-%B (P = 0.007) and HOMA-IR (P = 0.024). FEM1C variants were not associated with PCOS.
Conclusions: This study presents evidence suggesting a role for FEM1A and FEM1B in the pathogenesis of PCOS. Only FEM1B variants were associated with insulin-related traits in PCOS women, consistent with prior evidence linking this gene to insulin secretion. Replication of these associations and mechanistic studies will be necessary to establish the role of these genes in PCOS.
Figures


Similar articles
-
[Polymorphisms of FEM1A gene in patients with polycystic ovary syndrome].Zhonghua Yi Xue Yi Chuan Xue Za Zhi. 2012 Jun;29(3):338-42. doi: 10.3760/cma.j.issn.1003-9406.2012.03.020. Zhonghua Yi Xue Yi Chuan Xue Za Zhi. 2012. PMID: 22678803 Chinese.
-
FEM1A is a candidate gene for polycystic ovary syndrome.Gynecol Endocrinol. 2005 Dec;21(6):330-5. doi: 10.1080/09513590500431458. Gynecol Endocrinol. 2005. PMID: 16390781
-
Small glutamine-rich tetratricopeptide repeat-containing protein alpha (SGTA), a candidate gene for polycystic ovary syndrome.Hum Reprod. 2008 May;23(5):1214-9. doi: 10.1093/humrep/den065. Epub 2008 Mar 10. Hum Reprod. 2008. PMID: 18332089 Free PMC article.
-
GALNT2 Gene Variant rs4846914 Is Associated with Insulin and Insulin Resistance Depending on BMI in PCOS Patients: a Case-Control Study.Reprod Sci. 2021 Apr;28(4):1122-1132. doi: 10.1007/s43032-020-00380-7. Epub 2020 Nov 10. Reprod Sci. 2021. PMID: 33171515
-
[Genetic aspects of polycystic ovary syndrome].Endokrynol Pol. 2005 May-Jun;56(3):285-93. Endokrynol Pol. 2005. PMID: 16350721 Review. Polish.
Cited by
-
Interaction of sonic hedgehog (SHH) pathway with cancer stem cell genes in gastric cancer.Med Oncol. 2015 Mar;32(3):48. doi: 10.1007/s12032-015-0492-3. Epub 2015 Jan 31. Med Oncol. 2015. PMID: 25636508 Review.
-
Fem1b promotes ubiquitylation and suppresses transcriptional activity of Gli1.Biochem Biophys Res Commun. 2013 Oct 25;440(3):431-6. doi: 10.1016/j.bbrc.2013.09.090. Epub 2013 Sep 25. Biochem Biophys Res Commun. 2013. PMID: 24076122 Free PMC article.
-
RNA-seq Transcriptome Analysis in Ovarian Tissue of Pelibuey Breed to Explore the Regulation of Prolificacy.Genes (Basel). 2019 May 10;10(5):358. doi: 10.3390/genes10050358. Genes (Basel). 2019. PMID: 31083386 Free PMC article.
-
Genetic factors modulate the impact of pubertal androgen excess on insulin sensitivity and fertility.PLoS One. 2013 Nov 20;8(11):e79849. doi: 10.1371/journal.pone.0079849. eCollection 2013. PLoS One. 2013. PMID: 24278193 Free PMC article.
-
The structure and regulation of Cullin 2 based E3 ubiquitin ligases and their biological functions.Cell Div. 2016 May 23;11:7. doi: 10.1186/s13008-016-0020-7. eCollection 2016. Cell Div. 2016. PMID: 27222660 Free PMC article. Review.
References
-
- Amato G, Conte M, Mazziotti G, Lalli E, Vitolo G, Tucker AT, Bellastella A, Carella C, Izzo A. Serum and follicular fluid cytokines in polycystic ovary syndrome during stimulated cycles. Obstet Gynecol. 2003;101:1177–1182. - PubMed
-
- Araya AV, Aguirre A, Romero C, Miranda C, Molina MC, Ferreira A. Evaluation of tumor necrosis factor alpha production in ex vivo short term cultured whole blood from women with polycystic ovary syndrome. Eur Cytokine Netw. 2002;13:419–424. - PubMed
-
- Azziz R, Woods KS, Reyna R, Key TJ, Knochenhauer ES, Yildiz BO. The prevalence and features of the polycystic ovary syndrome in an unselected population. J Clin Endocrinol Metab. 2004;89:2745–2749. - PubMed
-
- Barrett JC, Fry B, Maller J, Daly MJ. Haploview: analysis and visualization of LD and haplotype maps. Bioinformatics. 2005;21:263–265. - PubMed
-
- Boots LR, Potter S, Potter HD, Azziz R. Measurement of total serum testosterone levels using commercially available kits: high degree of between-kit variability. Fertil Steril. 1998;69:286–292. - PubMed
Publication types
MeSH terms
Substances
Grants and funding
LinkOut - more resources
Full Text Sources
Medical
Molecular Biology Databases

