

Microsecond acquisition of heterogeneous structure in the folding of a TIM barrel protein
- PMID: 18757725
- PMCID: PMC2533196
- DOI: 10.1073/pnas.0802788105
Microsecond acquisition of heterogeneous structure in the folding of a TIM barrel protein
Abstract
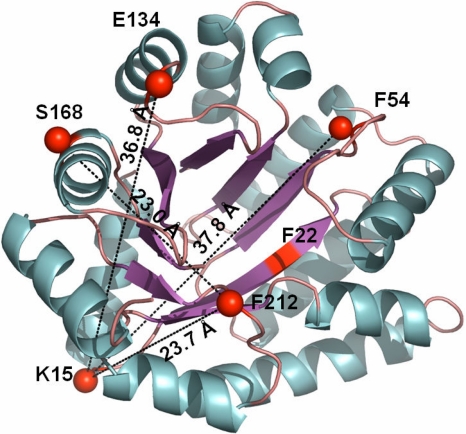
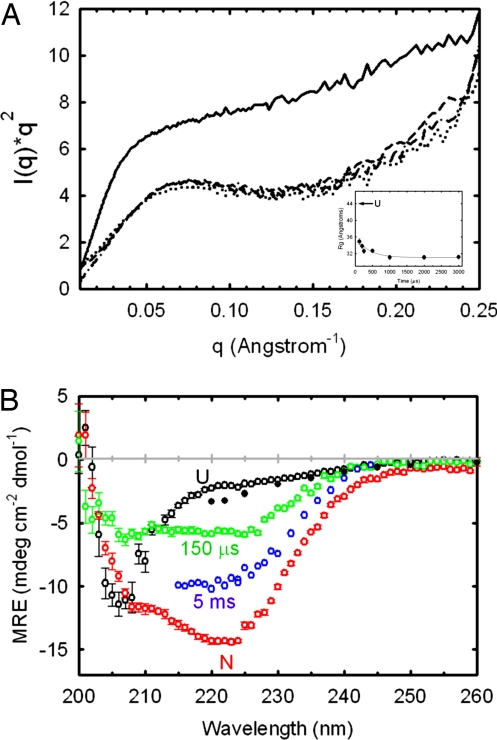
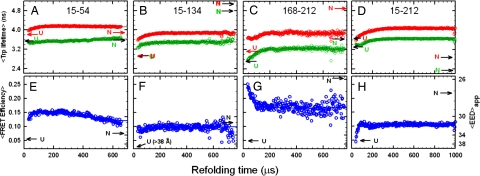
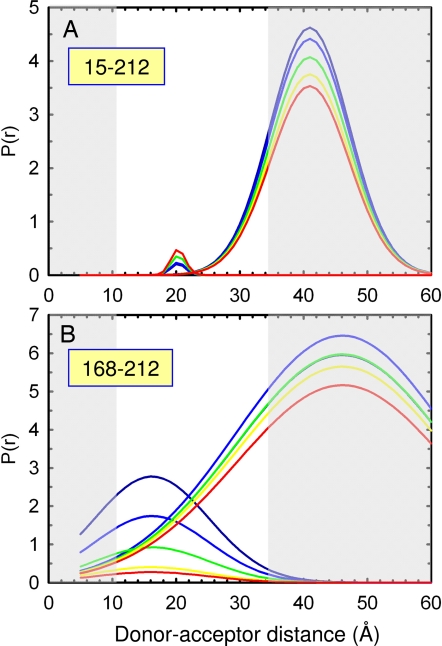
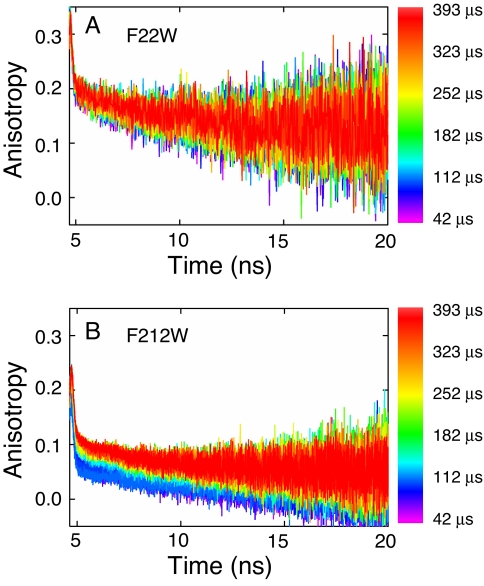
The earliest kinetic folding events for (betaalpha)(8) barrels reflect the appearance of off-pathway intermediates. Continuous-flow microchannel mixing methods interfaced to small-angle x-ray scattering (SAXS), circular dichroism (CD), time-resolved Förster resonant energy transfer (trFRET), and time-resolved fluorescence anisotropy (trFLAN) have been used to directly monitor global and specific dimensional properties of the partially folded state in the microsecond time range for a representative (betaalpha)(8) barrel protein. Within 150 micros, the alpha-subunit of Trp synthase (alphaTS) experiences a global collapse and the partial formation of secondary structure. The time resolution of the folding reaction was enhanced with trFRET and trFLAN to show that, within 30 micros, a distinct and autonomous partially collapsed structure has already formed in the N-terminal and central regions but not in the C-terminal region. A distance distribution analysis of the trFRET data confirmed the presence of a heterogeneous ensemble that persists for several hundreds of microseconds. Ready access to locally folded, stable substructures may be a hallmark of repeat-module proteins and the source of early kinetic traps in these very common motifs. Their folding free-energy landscapes should be elaborated to capture this source of frustration.
Conflict of interest statement
The authors declare no conflict of interest.
Figures
Similar articles
-
Frustration and folding of a TIM barrel protein.Proc Natl Acad Sci U S A. 2019 Aug 13;116(33):16378-16383. doi: 10.1073/pnas.1900880116. Epub 2019 Jul 25. Proc Natl Acad Sci U S A. 2019. PMID: 31346089 Free PMC article.
-
An obligatory intermediate controls the folding of the alpha-subunit of tryptophan synthase, a TIM barrel protein.J Mol Biol. 2005 Apr 15;347(5):911-9. doi: 10.1016/j.jmb.2005.01.064. J Mol Biol. 2005. PMID: 15784252
-
Specific structure appears at the N terminus in the sub-millisecond folding intermediate of the alpha subunit of tryptophan synthase, a TIM barrel protein.J Mol Biol. 2005 Aug 19;351(3):445-52. doi: 10.1016/j.jmb.2005.06.006. J Mol Biol. 2005. PMID: 16023136
-
The TIM-barrel fold: a versatile framework for efficient enzymes.FEBS Lett. 2001 Mar 16;492(3):193-8. doi: 10.1016/s0014-5793(01)02236-0. FEBS Lett. 2001. PMID: 11257493 Review.
-
The folding pathway of triosephosphate isomerase.Prog Mol Biol Transl Sci. 2008;84:251-67. doi: 10.1016/S0079-6603(08)00407-8. Prog Mol Biol Transl Sci. 2008. PMID: 19121704 Review. No abstract available.
Cited by
-
Non-native structure appears in microseconds during the folding of E. coli RNase H.J Mol Biol. 2015 Jan 30;427(2):443-53. doi: 10.1016/j.jmb.2014.10.003. Epub 2014 Oct 13. J Mol Biol. 2015. PMID: 25311861 Free PMC article.
-
The folding of single domain proteins--have we reached a consensus?Curr Opin Struct Biol. 2011 Feb;21(1):12-24. doi: 10.1016/j.sbi.2010.11.002. Epub 2010 Dec 6. Curr Opin Struct Biol. 2011. PMID: 21144739 Free PMC article. Review.
-
Indole-3-glycerol-phosphate synthase is recognized by a cold-inducible group II chaperonin in Thermococcus kodakarensis.Appl Environ Microbiol. 2012 Jun;78(11):3806-15. doi: 10.1128/AEM.07996-11. Epub 2012 Mar 23. Appl Environ Microbiol. 2012. PMID: 22447592 Free PMC article.
-
Computer design of microfluidic mixers for protein/RNA folding studies.PLoS One. 2018 Jun 20;13(6):e0198534. doi: 10.1371/journal.pone.0198534. eCollection 2018. PLoS One. 2018. PMID: 29924842 Free PMC article.
-
Folding of a large protein at high structural resolution.Proc Natl Acad Sci U S A. 2013 Nov 19;110(47):18898-903. doi: 10.1073/pnas.1319482110. Epub 2013 Nov 4. Proc Natl Acad Sci U S A. 2013. PMID: 24191053 Free PMC article.
References
-
- Onuchic JN, Wolynes PG. Theory of protein folding. Curr Opin Struct Biol. 2004;14:70–75. - PubMed
-
- Jackson SE. How do small single-domain proteins fold? Fold Des. 1998;3:R81–R91. - PubMed
-
- Gillespie B, Plaxco KW. Using protein folding rates to test protein folding theories. Annu Rev Biochem. 2004;73:837–859. - PubMed
Publication types
MeSH terms
Substances
Grants and funding
LinkOut - more resources
Full Text Sources
