. 2008 Nov 7;283(45):30821-7.
doi: 10.1074/jbc.M805654200. Epub 2008 Aug 30.

Doc of prophage P1 is inhibited by its antitoxin partner Phd through fold complementation

Affiliations

Doc of prophage P1 is inhibited by its antitoxin partner Phd through fold complementation

Abel Garcia-Pino et al. J Biol Chem. .

Abstract

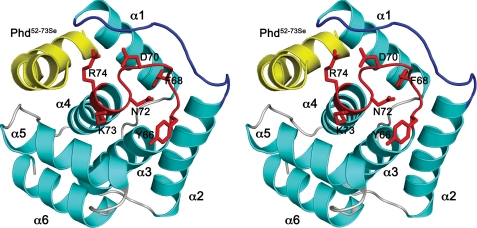
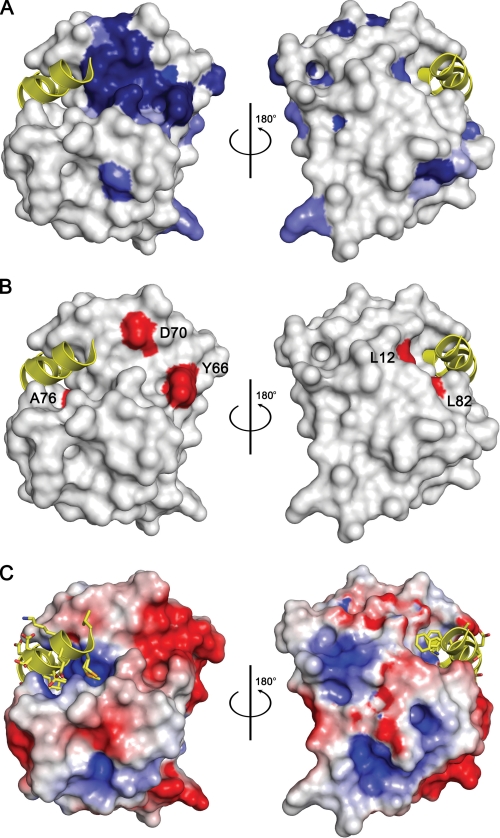
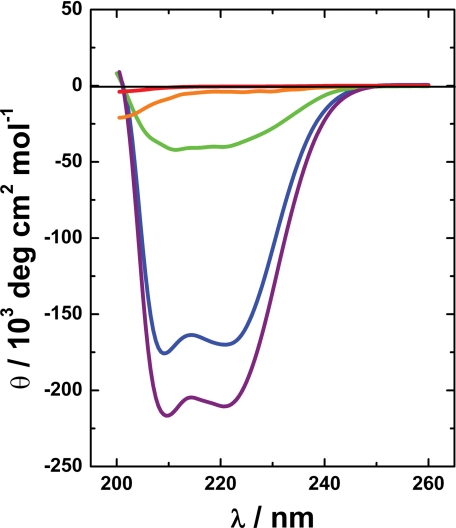
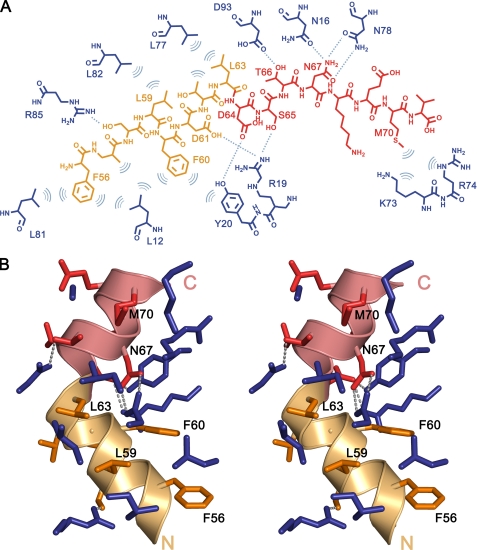
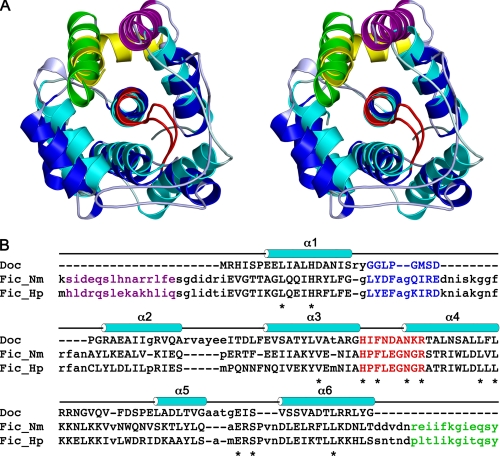
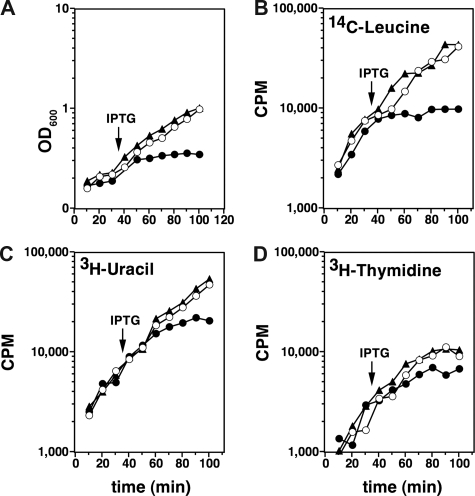
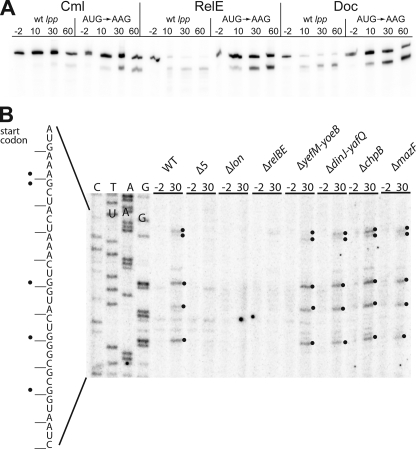
Prokaryotic toxin-antitoxin modules are involved in major physiological events set in motion under stress conditions. The toxin Doc (death on curing) from the phd/doc module on phage P1 hosts the C-terminal domain of its antitoxin partner Phd (prevents host death) through fold complementation. This Phd domain is intrinsically disordered in solution and folds into an alpha-helix upon binding to Doc. The details of the interactions reveal the molecular basis for the inhibitory action of the antitoxin. The complex resembles the Fic (filamentation induced by cAMP) proteins and suggests a possible evolutionary origin for the phd/doc operon. Doc induces growth arrest of Escherichia coli cells in a reversible manner, by targeting the protein synthesis machinery. Moreover, Doc activates the endogenous E. coli RelE mRNA interferase but does not require this or any other known chromosomal toxin-antitoxin locus for its action in vivo.


Figures

FIGURE 1.
FIGURE 1.
Structure of Doc. A, stereo view of the DocH66Y-Phd52–73Se complex. Helices of DocH66Y are shown in cyan, and loop structures are shown in gray. The α-helices are labeled. The loop α3-α4 containing the conserved sequence motif HXFX(D/E)(A/G)N(K/G)R is highlighted in red, and its side chains are shown as sticks. Loop α1-α2 is highlighted in blue. The bound Phd52–73Se fragment is shown in yellow.
FIGURE 2.
FIGURE 2.
Residue conservation and Phd-binding site of Doc. A, surface representation of DocH66Y. Residues that are conserved in Doc sequences are colored blue with the intensity of the color reflecting the degree of conservation: darkest blue represents full conservation in all sequences, and lightest blue represents 50% conservation (residue conservation calculated according to Livingstone and Barton (39) and based upon the sequence alignment shown in supplemental Fig. S1). Two views are shown 180° apart. The bound fragment of Phd is shown as a yellow helix ribbon. B, mapping of toxicity-eliminating mutations on the surface of Doc. Residues that lead to a non-toxic form of P1 Doc (19) are colored red and labeled. Asp-60 and Tyr-66 are part of the conserved sequence motif. Leu-12 and Leu-82 are within the Phd52–73Se-binding site. However, the corresponding mutations L12P and L82P are likely to disrupt helices α1 and α4, respectively, in agreement with the observation that both lead to a protein that loses its toxicity as well as its regulatory activity. The orientations are the same as in panel A. C, electrostatic surface potential mapped on the surface of Doc. Negatively charged regions are colored red, and positively charged regions are colored blue. The bound fragment of Phd is shown as a yellow helix ribbon. The orientations are the same as in panel A.
FIGURE 3.
FIGURE 3.
Solution structures of Phd52–73Se and DocH66Y. The far UV CD spectrum of isolated Phd52–73Se 60 μm (red) and 300 μm (orange) is characteristic of an intrinsically unstructured protein with a weak minimum around 200 nm. Consistent with its crystal structure, the spectrum of DocH66Y in blue (60 μm) is dominated by a high α-helical content, which is further increased in the DocH66Y-Phd52–73Se complex (purple). The difference spectrum between the complex and free DocH66Y (in green) shows that Phd52–73Se in its bound state is mostly α-helical with the typical minima at 210 and 221 nm.
FIGURE 4.
FIGURE 4.
Interactions between Phd52–73Se and DocH66Y. A, schematic drawing of interacting residues in DocH66Y (blue) and Phd52–73Se. The N-terminal α-helical region of the peptide (residues 52–63), predominantly hydrophobic, is colored in orange. The C-terminal region of the peptide, predominantly hydrophilic, is colored in red. Hydrogen bonds (cutoff level 3.5 Å) are shown as dashed lines, and hydrophobic interactions are represented as arcs. B, stereo view of the DocH66Y-Phd52–73Se complex interface. Residues are colored as in panel A. Phd52–73Se residues that are buried in the interface are indicated. Hydrogen bonds are shown as dashed lines.
FIGURE 5.
FIGURE 5.
Doc has an incomplete Fic-like fold. A, stereo view of the superposition between DocH66Y and Fic from N. meningitidis (Fic_Nm). DocH66Y is shown in cyan, and the bound Phd52–73Se fragment is shown in yellow. Fic_Nm is shown in blue, and its C-terminal helix is shown in green. The loops α3-α4 containing the conserved sequence motif are highlighted in red for both proteins. The N-terminal α-helix of Fic, which has no counterpart in Doc, is shown in purple. B, structure-based sequence alignment of Doc with Fic_Nm (PDB entry 2G03) and Fic_Hp (PDB entry 2F6S). The proteins were aligned to Doc using SALIGN (40). Residues with a structural match to Doc are shown in uppercase, and those that are structurally divergent from Doc and do not allow for a 1:1 match are shown in lowercase. The α-helices in Doc are indicated above the sequence. Residues corresponding to the conserved sequence motif in loop α3-α4 are highlighted in red, and conserved residues are indicated with asterisks. The loop α1-α2 is highlighted in blue. Residues from the C-terminal α-helix from the Fic proteins are shown in green, and those of the N-terminal α-helix are shown in purple.
FIGURE 6.
FIGURE 6.
Effect of Doc on growth and macromolecular synthesis. Open circles correspond to BR7046 (carrying wild-type Doc) without induction by IPTG. Filled circles correspond to BR7046 with induction of Doc by IPTG (time of induction indicated by an arrow). Filled triangles correspond to BR7044 carrying Ptac-docH66Y and induced at the same moment as BR7046. A, induction of Doc leads to a quick cessation of growth. B, the effect of Doc on protein synthesis as measured by incorporation of 14C leucine is pronounced and parallels the cessation of growth. C and D, the effects of Doc on RNA and DNA synthesis measured by the incorporation of [3H]uracil and [3H]thymidine, respectively, are less pronounced and somewhat lag behind the effects on growth and protein synthesis, indicative of a secondary rather than a primary effect. See supplemental Material and Methods for further details.
FIGURE 7.
FIGURE 7.
Induction of RelE activity by Doc. A, Doc induces cleavage of a translated model lpp mRNA. Cells of MG1655Δlpp/MG3323 (pBAD-relE) and MG1655Δlpp/pMCD3303 (pBAD-doc) containing either of the plasmids pSC710 (wild-type (wt) lpp) or pSC711 (ATG start codon of lpp changed to AAG) were grown exponentially in LB medium at 37 °C. To induce transcription of the toxin genes, arabinose (0.2%) was added at time 0. As a control, the strains MG1655Δlpp/pSC710 and MG1655Δlpp/pSC711 were treated with chloramphenicol (Cml) (50 μg/ml) at time 0 to inhibit translation. Total RNA samples were fractionated by PAGE, and lpp mRNA was visualized by Northern blotting analysis. Numbers are time points of cell sampling relative to inhibition of translation by either chloramphenicol or arabinose. B, overproduction of Doc induces RelE-dependent mRNA cleavage. Primer extension analysis of lpp mRNA after transcriptional induction of doc from pMCD3303 (pBAD-doc) in the following strains: MG1655 (wild type), Δ5 (SC301467), Δlon, ΔrelBE (SC31), ΔyefM-yoeB (SC36), ΔdinJ-yafQ (SC37), ΔmazF (SC30), and ΔchpB (SC31). The strains were grown in LB medium to an A450 nm of 0.5, and total RNA was prepared from bacterial samples taken at the indicated time points (-2 and 30 min) after the addition of 0.2% arabinose. Primer extension was performed as described under “Experimental Procedures” using 32P-labeled primer lpp21. Significant cleavage sites in the RNA are marked with black dots on the gel and in the corresponding sequence to the left.

References

    1. Buts, L., Lah, J., Dao-Thi, M. H., Wyns, L., and Loris, R. (2005) Trends Biochem. Sci 30 672-679 - PubMed
    1. Gerdes, K., Christensen, S. K., and Lobner-Olesen, A. (2005) Nat. Rev. Microbiol. 3 371-382 - PubMed
    1. Pedersen, K., Christensen, S. K., and Gerdes, K. (2002) Mol. Microbiol. 45 501-510 - PubMed
    1. Pandey, D. P., and Gerdes, K. (2005) Nucleic Acids Res. 33 966-976 - PMC - PubMed
    1. Shah, D., Zhang, Z., Khodursky, A., Kaldalu, N., Kurg, K., and Lewis, K. (2006) BMC Microbiol. 6 53. - PMC - PubMed

Publication types

MeSH terms

LinkOut - more resources