

The phenomics and expression quantitative trait locus mapping of brain transcriptomes regulating adaptive divergence in lake whitefish species pairs (Coregonus sp.)
- PMID: 18757926
- PMCID: PMC2535670
- DOI: 10.1534/genetics.108.089938
The phenomics and expression quantitative trait locus mapping of brain transcriptomes regulating adaptive divergence in lake whitefish species pairs (Coregonus sp.)
Abstract
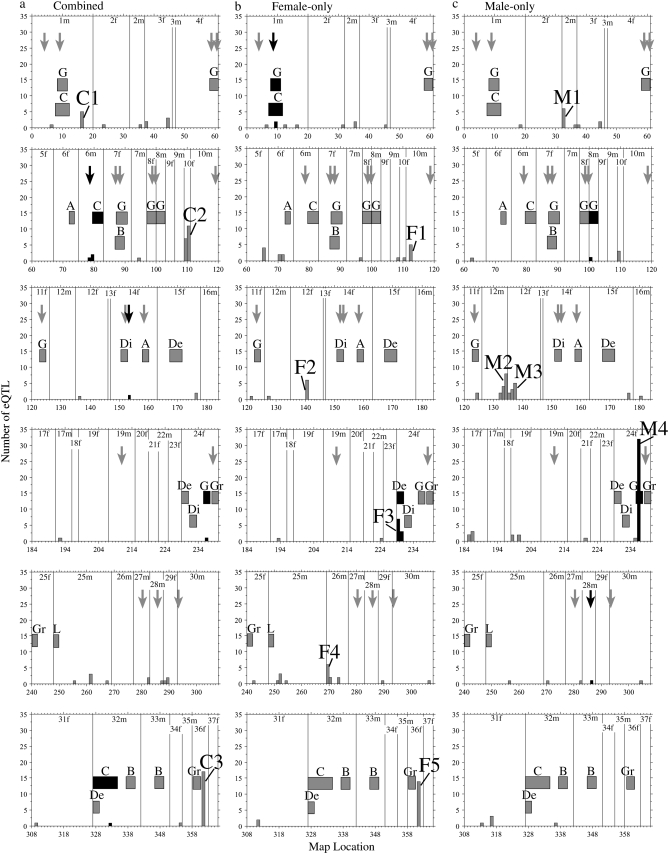
We used microarrays and a previously established linkage map to localize the genetic determinants of brain gene expression for a backcross family of lake whitefish species pairs (Coregonus sp.). Our goals were to elucidate the genomic distribution and sex specificity of brain expression QTL (eQTL) and to determine the extent to which genes controlling transcriptional variation may underlie adaptive divergence in the recently evolved dwarf (limnetic) and normal (benthic) whitefish. We observed a sex bias in transcriptional genetic architecture, with more eQTL observed in males, as well as divergence in genome location of eQTL between the sexes. Hotspots of nonrandom aggregations of up to 32 eQTL in one location were observed. We identified candidate genes for species pair divergence involved with energetic metabolism, protein synthesis, and neural development on the basis of colocalization of eQTL for these genes with eight previously identified adaptive phenotypic QTL and four previously identified outlier loci from a genome scan in natural populations. Eighty-eight percent of eQTL-phenotypic QTL colocalization involved growth rate and condition factor QTL, two traits central to adaptive divergence between whitefish species pairs. Hotspots colocalized with phenotypic QTL in several cases, revealing possible locations where master regulatory genes, such as a zinc-finger protein in one case, control gene expression directly related to adaptive phenotypic divergence. We observed little evidence of colocalization of brain eQTL with behavioral QTL, which provides insight into the genes identified by behavioral QTL studies. These results extend to the transcriptome level previous work illustrating that selection has shaped recent parallel divergence between dwarf and normal lake whitefish species pairs and that metabolic, more than morphological, differences appear to play a key role in this divergence.
Figures
Similar articles
-
Pervasive sex-linked effects on transcription regulation as revealed by expression quantitative trait loci mapping in lake whitefish species pairs (Coregonus sp., Salmonidae).Genetics. 2008 Aug;179(4):1903-17. doi: 10.1534/genetics.107.086306. Epub 2008 Jul 27. Genetics. 2008. PMID: 18660540 Free PMC article.
-
The genetic architecture of ecological speciation and the association with signatures of selection in natural lake whitefish (Coregonus sp. Salmonidae) species pairs.Mol Biol Evol. 2007 Jun;24(6):1423-38. doi: 10.1093/molbev/msm066. Epub 2007 Apr 2. Mol Biol Evol. 2007. PMID: 17404398
-
Mapping phenotypic, expression and transmission ratio distortion QTL using RAD markers in the Lake Whitefish (Coregonus clupeaformis).Mol Ecol. 2013 Jun;22(11):3036-48. doi: 10.1111/mec.12127. Epub 2012 Nov 26. Mol Ecol. 2013. PMID: 23181719
-
On the origin of species: insights from the ecological genomics of lake whitefish.Philos Trans R Soc Lond B Biol Sci. 2010 Jun 12;365(1547):1783-800. doi: 10.1098/rstb.2009.0274. Philos Trans R Soc Lond B Biol Sci. 2010. PMID: 20439281 Free PMC article. Review.
-
Systems genetics, bioinformatics and eQTL mapping.Genetica. 2010 Oct;138(9-10):915-24. doi: 10.1007/s10709-010-9480-x. Epub 2010 Sep 3. Genetica. 2010. PMID: 20811929 Review.
Cited by
-
Toward Darwinian fisheries management.Evol Appl. 2009 Aug;2(3):245-59. doi: 10.1111/j.1752-4571.2009.00087.x. Evol Appl. 2009. PMID: 25567878 Free PMC article.
-
Expression quantitative trait loci are highly sensitive to cellular differentiation state.PLoS Genet. 2009 Oct;5(10):e1000692. doi: 10.1371/journal.pgen.1000692. Epub 2009 Oct 16. PLoS Genet. 2009. PMID: 19834560 Free PMC article.
-
Regulatory versus coding signatures of natural selection in a candidate gene involved in the adaptive divergence of whitefish species pairs (Coregonus spp.).Ecol Evol. 2012 Jan;2(1):258-71. doi: 10.1002/ece3.52. Ecol Evol. 2012. PMID: 22408741 Free PMC article.
-
Genome-wide patterns of divergence during speciation: the lake whitefish case study.Philos Trans R Soc Lond B Biol Sci. 2012 Feb 5;367(1587):354-63. doi: 10.1098/rstb.2011.0197. Philos Trans R Soc Lond B Biol Sci. 2012. PMID: 22201165 Free PMC article.
-
Speciation genetics: current status and evolving approaches.Philos Trans R Soc Lond B Biol Sci. 2010 Jun 12;365(1547):1717-33. doi: 10.1098/rstb.2010.0023. Philos Trans R Soc Lond B Biol Sci. 2010. PMID: 20439277 Free PMC article. Review.
References
-
- Aubin-Horth, N., B. H. Letcher and H. A. Hofmann, 2005. b Interaction of rearing environment and reproductive tactic on gene expression profiles in Atlantic salmon. J. Hered. 96 261–278. - PubMed
-
- Aubin-Horth, N., J. K. Desjardins, Y. M. Martei, S. Balshine and H. A. Hofmann, 2007. Masculinized dominant females in a cooperatively breeding species. Mol. Ecol. 16 1349–1358. - PubMed
-
- Basten, C. J., B. S. Weir and Z.-B. Zeng, 2002. QTL cartographer, in Program in Statistical Genetics. Bioinformatics Research Center, Department of Statistics, North Carolina State University, Raleigh, NC.
Publication types
MeSH terms
LinkOut - more resources
Full Text Sources
Molecular Biology Databases
